![]()

The Singular Spectrum Analysis Library (SSALib) is a Python package for univariate (i.e., single) time series decomposition, designed for multidisciplinary applications like natural sciences, economics, epidemiology, and more. SSALib can be used to explore and extract trends, periodic patterns, and noise from time series.
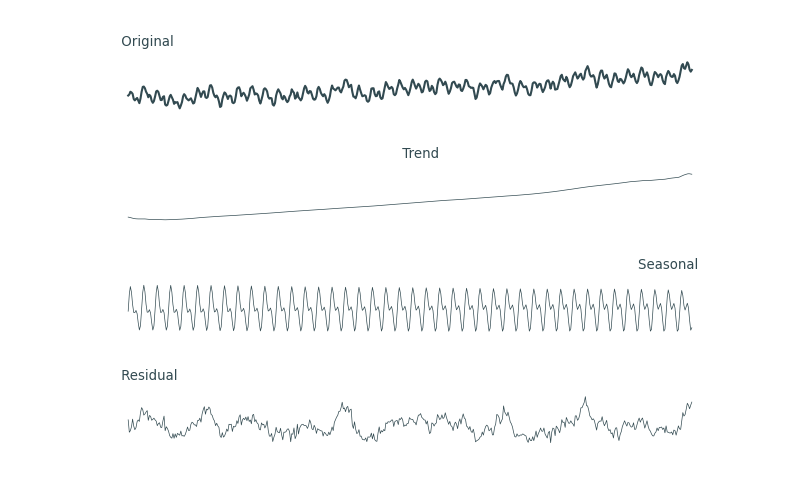 Figure: Example of Decomposition and Pattern Extraction (standardized) using
the Sea Surface Temperature Time Series
Figure: Example of Decomposition and Pattern Extraction (standardized) using
the Sea Surface Temperature Time Series
- Univariate SSA implementation with both Broemhead & King and Vautard and Ghil approaches
- Multiple SVD solver options (NumPy, SciPy, scikit-learn)
- Monte Carlo SSA for significance testing
- Built-in visualization tools for analysis
- Include example datasets
- Comprehensive test coverage
- Type-annotated codebase
- Python ≥ 3.9
- NumPy
- SciPy < 1.16.0
- Pandas
- Matplotlib
- Scikit-learn
- Statsmodels
Use
pip install git+https://github.com/ADSCIAN/ssalib.gitor
pip install ssalib
from ssalib import SingularSpectrumAnalysis
from ssalib.datasets import load_sst

# Load example data: Mean Sea Surface Temperature
ts = load_sst()

# Create SSA instance and decompose
ssa = SingularSpectrumAnalysis(ts)
ssa.decompose()

# Visualize results, in this case, singular values
fig, ax = ssa.plot(kind='values')

# Reconstruct groups
ssa.reconstruct(groups={'trend': [0, 1], 'seasonality': [2, 3]})

# Export
df_ssa = ssa.to_frame()| Dataset | Loading Function | Description | Time Range | Source | License |
|---|---|---|---|---|---|
| Mortality | load_mortality() |
Daily counts of deaths in Belgium. | 1992-01-01 to 2023-12-31 | STATBEL | Open Data |
| SST | load_sst() |
Monthly mean sea surface temperature globally between 60° North and South. | 1982-01-01 to 2023-12-31 | Climate Reanalyzer | CC-BY |
SSALib supports multiple SVD solvers:
| Solver Name | Underlying Method | Status |
|---|---|---|
numpy_standard |
numpy.linalg.svd |
Default |
scipy_standard |
scipy.linalg.svd |
Available |
scipy_sparse |
scipy.sparse.linalg.svds |
Available |
sklearn_randomized |
sklearn.utils.extmath.randomized_svd |
Available |
Select the solver with the svd_solver argument.
from ssalib import SingularSpectrumAnalysis
from ssalib.datasets import load_sst

# Load example data
ts = load_sst()

# Create SSA instance with solver 'sklearn_randomized'
ssa = SingularSpectrumAnalysis(ts, svd_solver='sklearn_randomized')kind |
Description | Decomposition Required | Reconstruction Required |
|---|---|---|---|
matrix |
Plot the matrix or its group reconstruction | Optional | Optional |
paired |
Plot pairs (x,y) of successive left-eigenvectors | Yes | No |
periodogram |
Plot periodogram associated with eigenvectors | Yes | No |
timeseries |
Plot original, preprocessed, or reconstructed time series | Optional | Optional |
values |
Plot the singular values ranked by value norm or dominant component frequency | Yes | No |
vectors |
Plot the left eigen vectors | Yes | No |
wcorr |
Plot the weighted correlation matrix | Yes | No |
Pass the kind argument to the SingularSpectrumAnalysis.plot method.
For more in-depth examples and tutorials, check the Jupyter notebooks in the
notebooks folder:
- Tutorial 1: Introduction to SSA
- Tutorial 2: Plotting Guide
- Tutorial 3: SVD Matrix Construction and Window Sizes
- Tutorial 4: Comparison of SVD Solvers and Speed Performances
- Tutorial 5: Comparison of SSALib and Rssa
In more advanced tutorials, we cover:
The main references used to develop SSALib were:
- Golyandina, N., & Zhigljavsky, A. (2020). Singular Spectrum Analysis for Time Series. Berlin, Heidelberg: Springer. https://doi.org/10.1007/978-3-662-62436-4
- Hassani, H. (2007). Singular Spectrum Analysis: Methodology and Comparison. Journal of Data Science, 5(2), 239–257. https://doi.org/10.6339/JDS.2007.05(2).396
- Broomhead, D. S., & King, G. P. (1986). Extracting qualitative dynamics from experimental data. Physica D: Nonlinear Phenomena, 20(2), 217–236. https://doi.org/10.1016/0167-2789(86)90031-X
- Vautard, R., & Ghil, M. (1989). Singular spectrum analysis in nonlinear dynamics, with applications to paleoclimatic time series. Physica D: Nonlinear Phenomena, 35(3). https://doi.org/10.1016/0167-2789(89)90077-8
- Allen, M. R., & Smith, L. A. (1996). Monte Carlo SSA: Detecting irregular oscillations in the Presence of Colored Noise. Journal of Climate, 9(12), 3373–3404. https://doi.org/10.1175/1520-0442(1996)009<3373:MCSDIO>2.0.CO;2
Awaiting the release of the first non-beta version, you can refer to SSALib using:
@software{ssalib2025,
  author    = {Delforge, Damien AND Alonso, Alice AND de Viron, Olivier AND Vanclooster, Marnik AND Speybroeck, Niko},
  title     = {{SSALib}: A {Python} Library for {Singular Spectrum Analysis}},
  year      = {2025},
  version   = {0.1.2b1},
  url       = {https://github.com/ADSCIAN/ssalib}
}