A high-performance, real-time system for detecting faces with and without masks, leveraging the state-of-the-art YOLOv10 object detection model. This project is fine-tuned on a custom dataset to provide accurate and efficient monitoring in various environments.
The goal of this project is to accurately identify and differentiate between individuals wearing masks (with_mask) and those who are not (unmasked), using video or image data. By fine-tuning the incredibly efficient YOLOv10 model, this system achieves high accuracy and real-time processing speeds, making it suitable for deployment in public spaces, workplaces, and other areas where health and safety monitoring is crucial.
- State-of-the-Art Model: Utilizes YOLOv10n, the latest in the YOLO series, known for its exceptional speed and accuracy.
- Custom-Trained: Fine-tuned on a custom dataset specifically for mask detection, ensuring high performance on the target classes.
- Two-Class Detection: Accurately classifies two distinct categories:
with_maskandunmasked. - High Performance: Achieves an impressive mAP(50-95) of 0.856, demonstrating robust detection capabilities.
- Reproducible Workflow: Includes pre-configured Google Colab notebooks for both training and inference, allowing for easy replication and use.
A thorough analysis of the dataset was conducted to understand its characteristics before training.
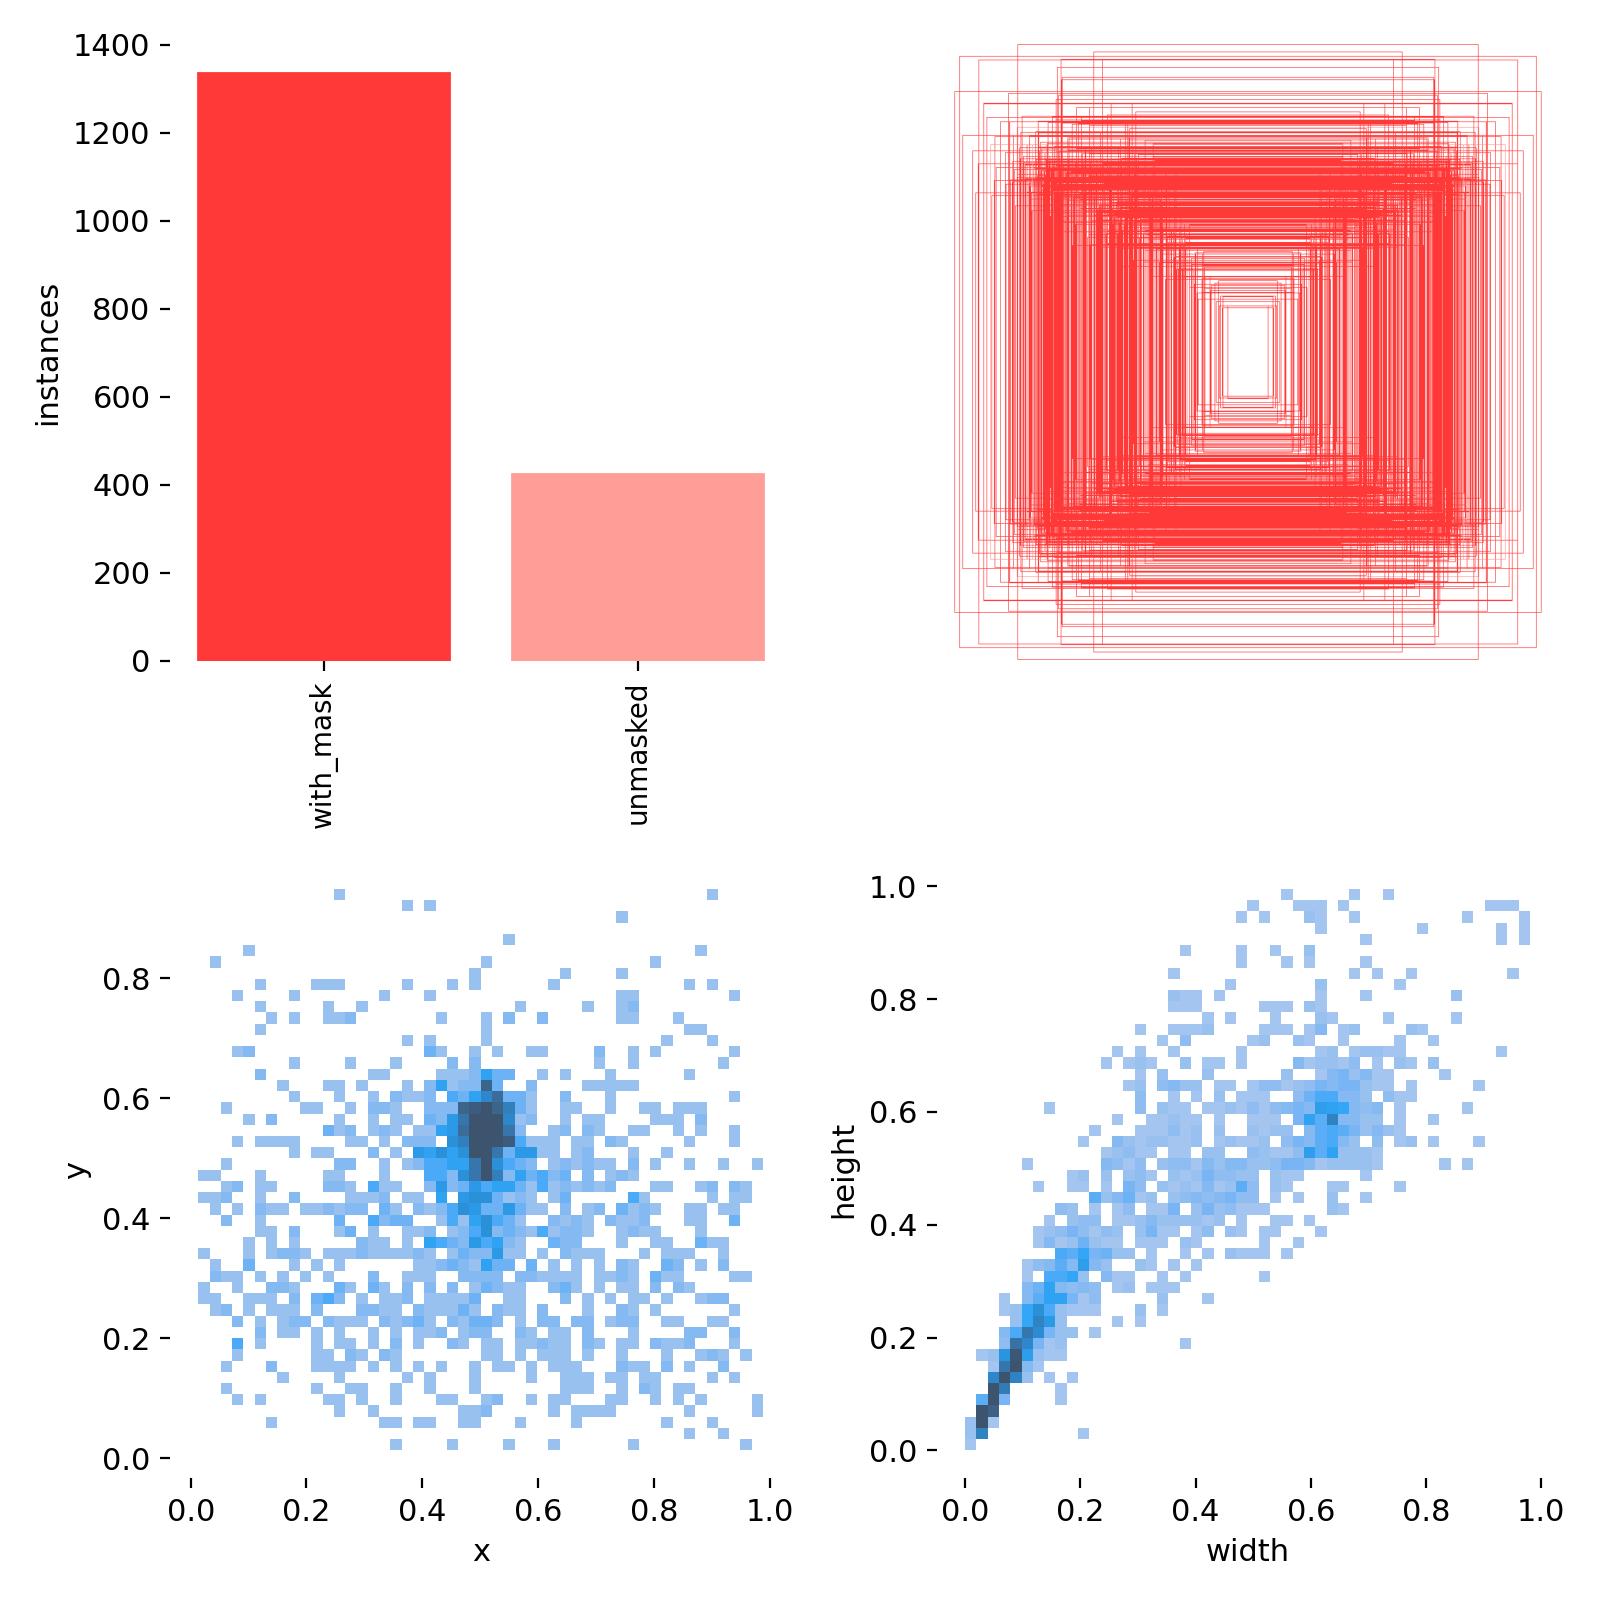
- Class Imbalance: The bar chart clearly shows that the dataset contains significantly more instances of the
with_maskclass (approx. 1350 instances) than theunmaskedclass (approx. 450 instances). This is a realistic scenario but one that requires a robust model to prevent bias. - Spatial Distribution: The scatter plot of
yvsxcoordinates shows that the objects (faces) are predominantly centered within the images, which is ideal for training. - Size Distribution: The
heightvswidthscatter plot indicates a consistent aspect ratio for the bounding boxes, suggesting that the objects were captured from a similar distance and perspective.
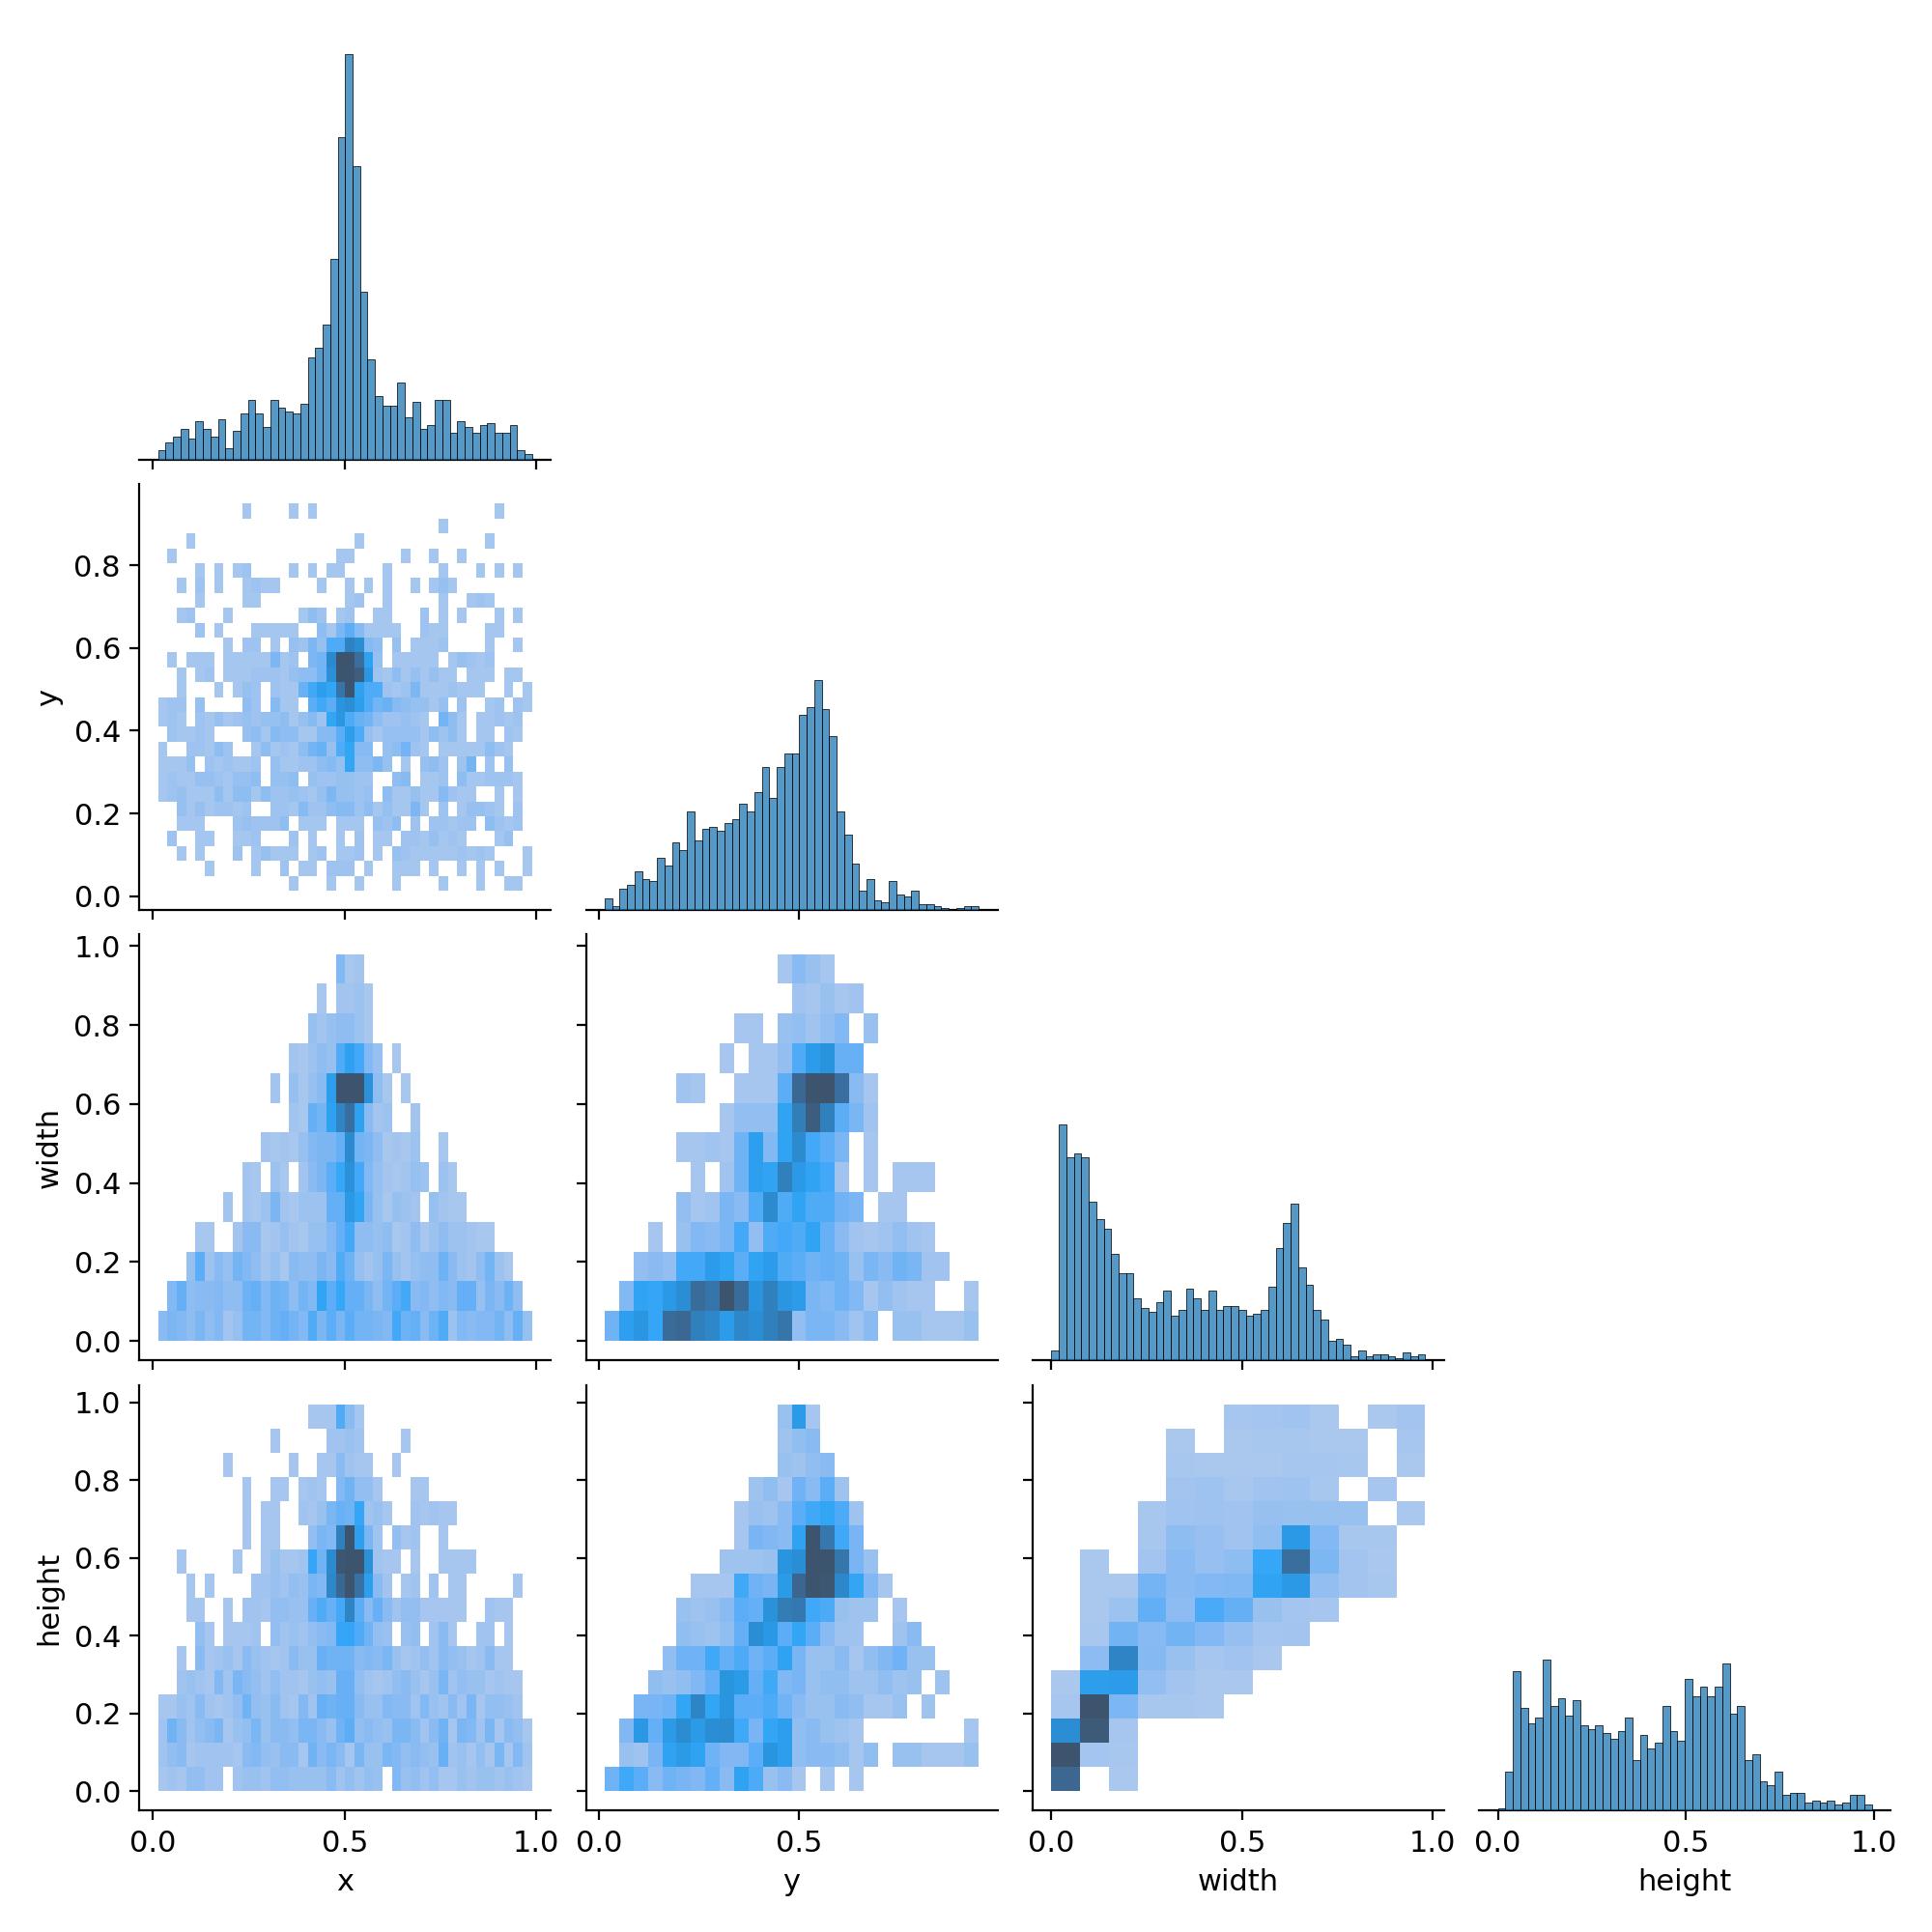
- The correlogram provides a deeper look into the relationships between bounding box attributes. The strong correlations between
x/yandwidth/heightconfirm the centralized and uniformly-sized nature of the objects in the dataset, which contributes to stable training.
The model was trained for 50 epochs, and its performance was rigorously evaluated.
The final metrics demonstrate a highly effective model, especially for the majority class.
| Class | Images | Labels | Precision | Recall | mAP50-95 | mAP50 |
|---|---|---|---|---|---|---|
with_mask |
548 | 1339 | 0.932 | 0.898 | 0.923 | 0.985 |
unmasked |
548 | 434 | 0.893 | 0.818 | 0.789 | 0.949 |
| all | 548 | 1773 | 0.913 | 0.858 | 0.856 | 0.967 |
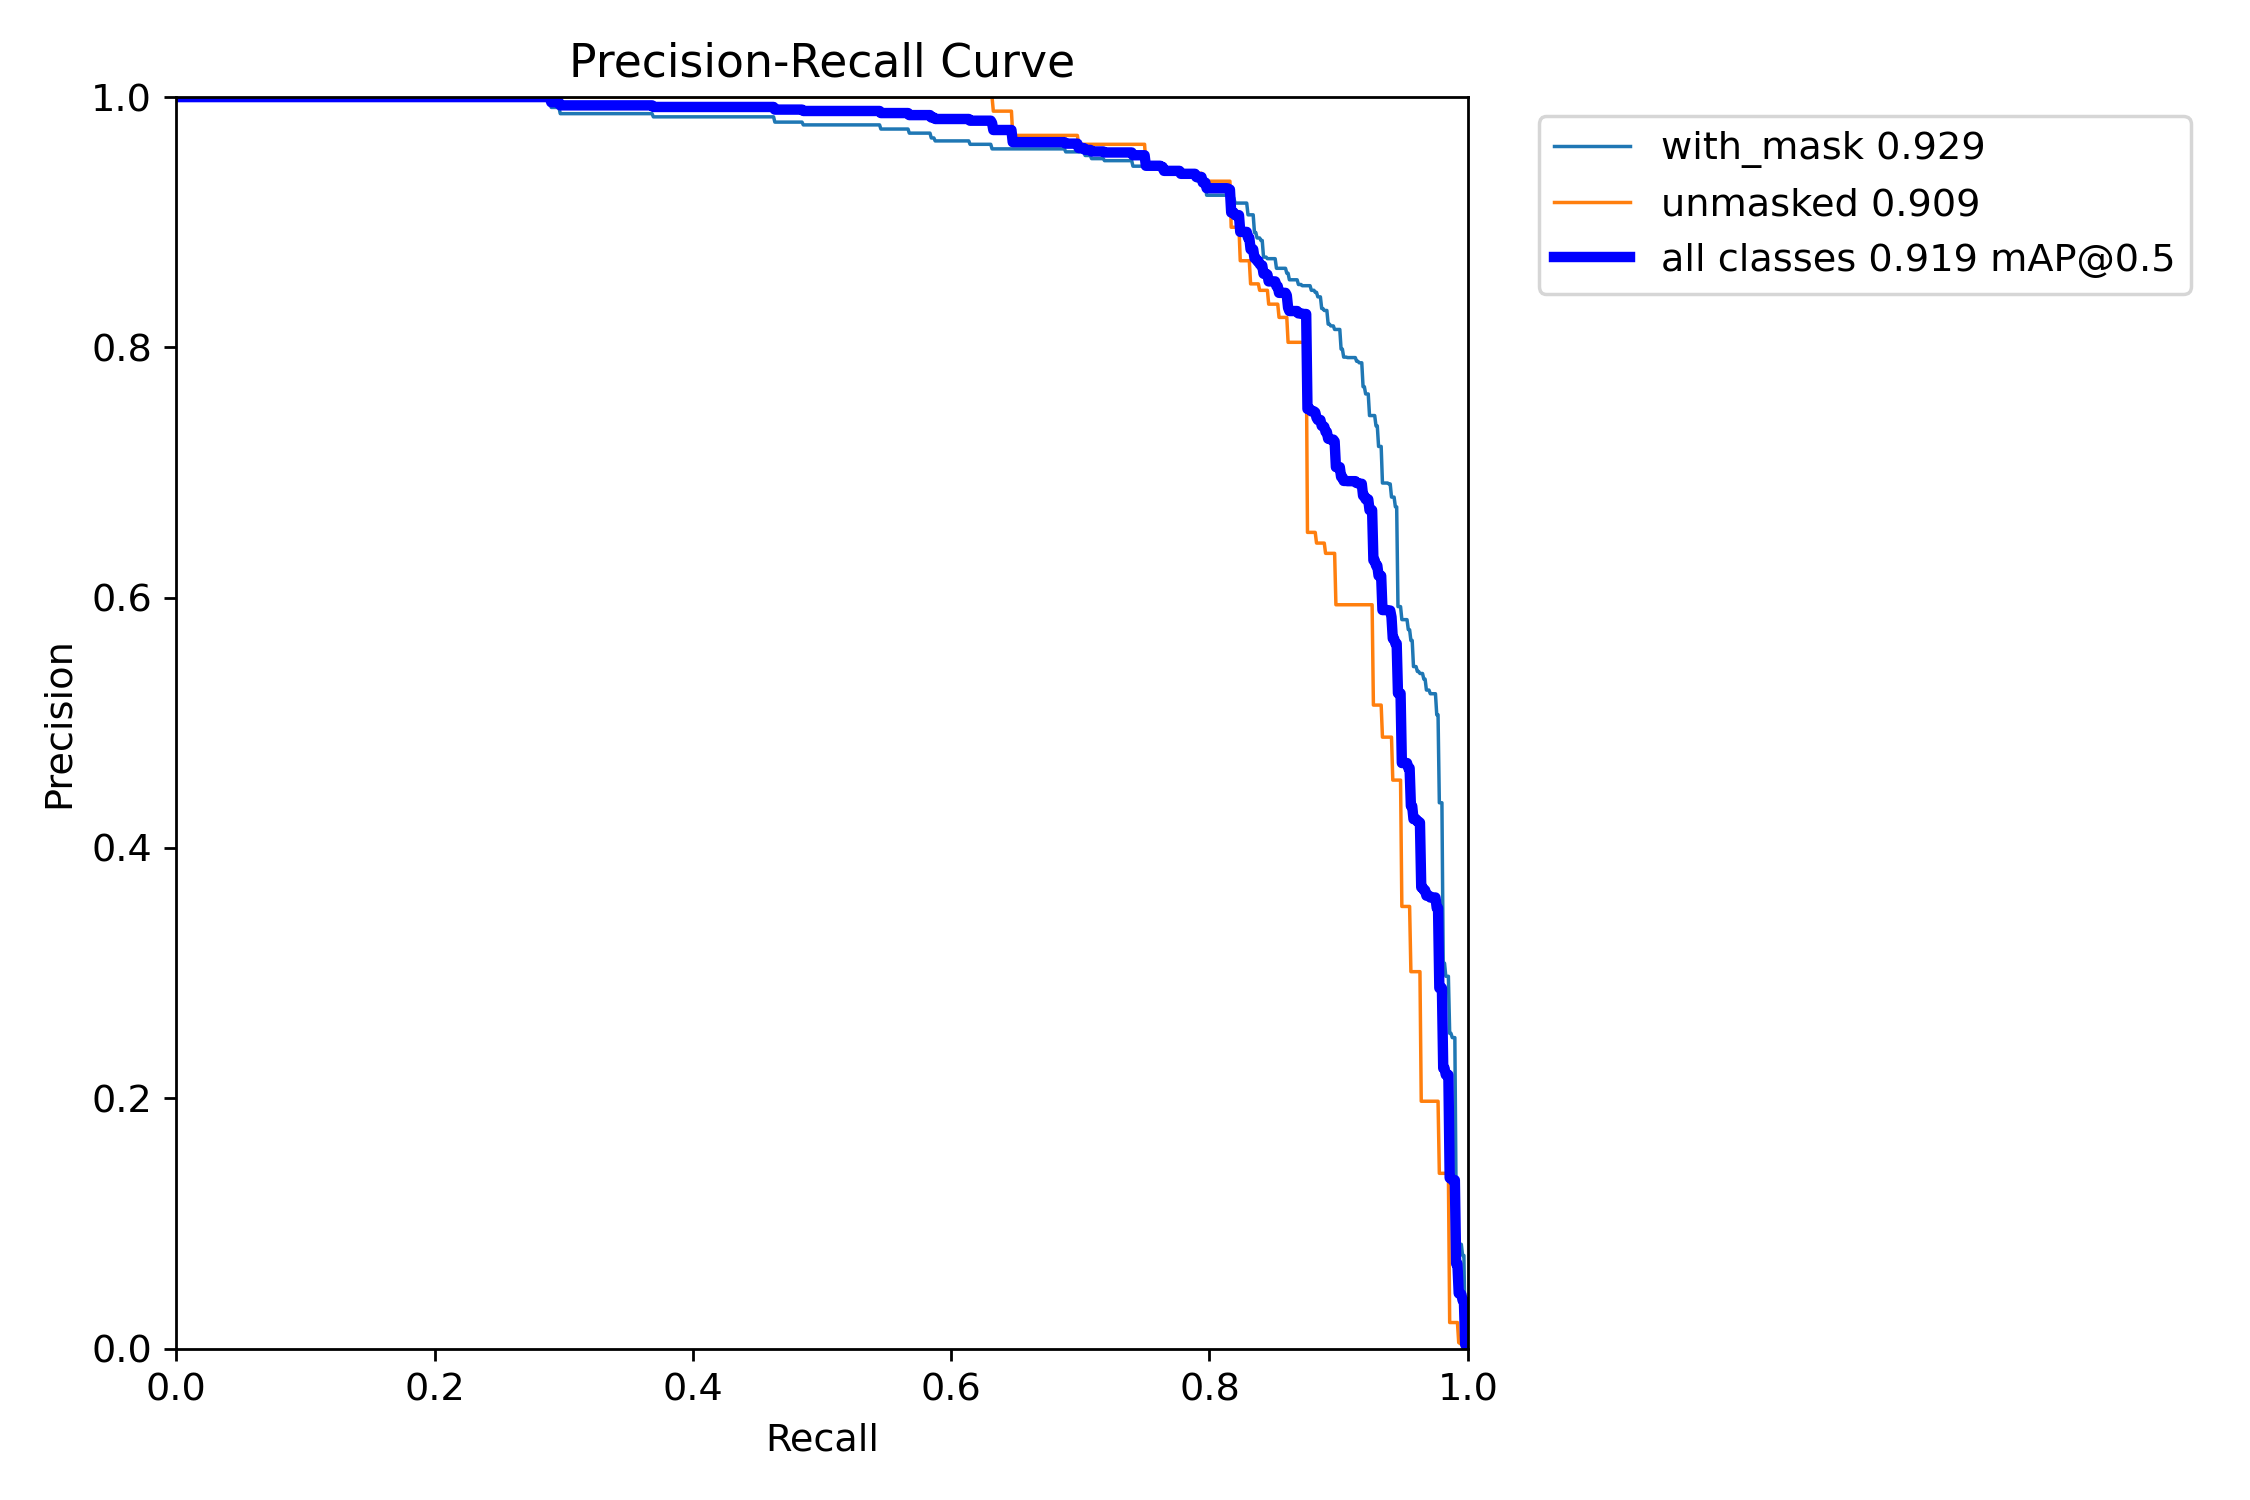
- This curve shows the trade-off between precision (how many detections are correct) and recall (how many actual objects are found). The large area under the curve, resulting in a mean Average Precision (mAP) of 0.856, indicates that the model maintains high precision even while achieving high recall.
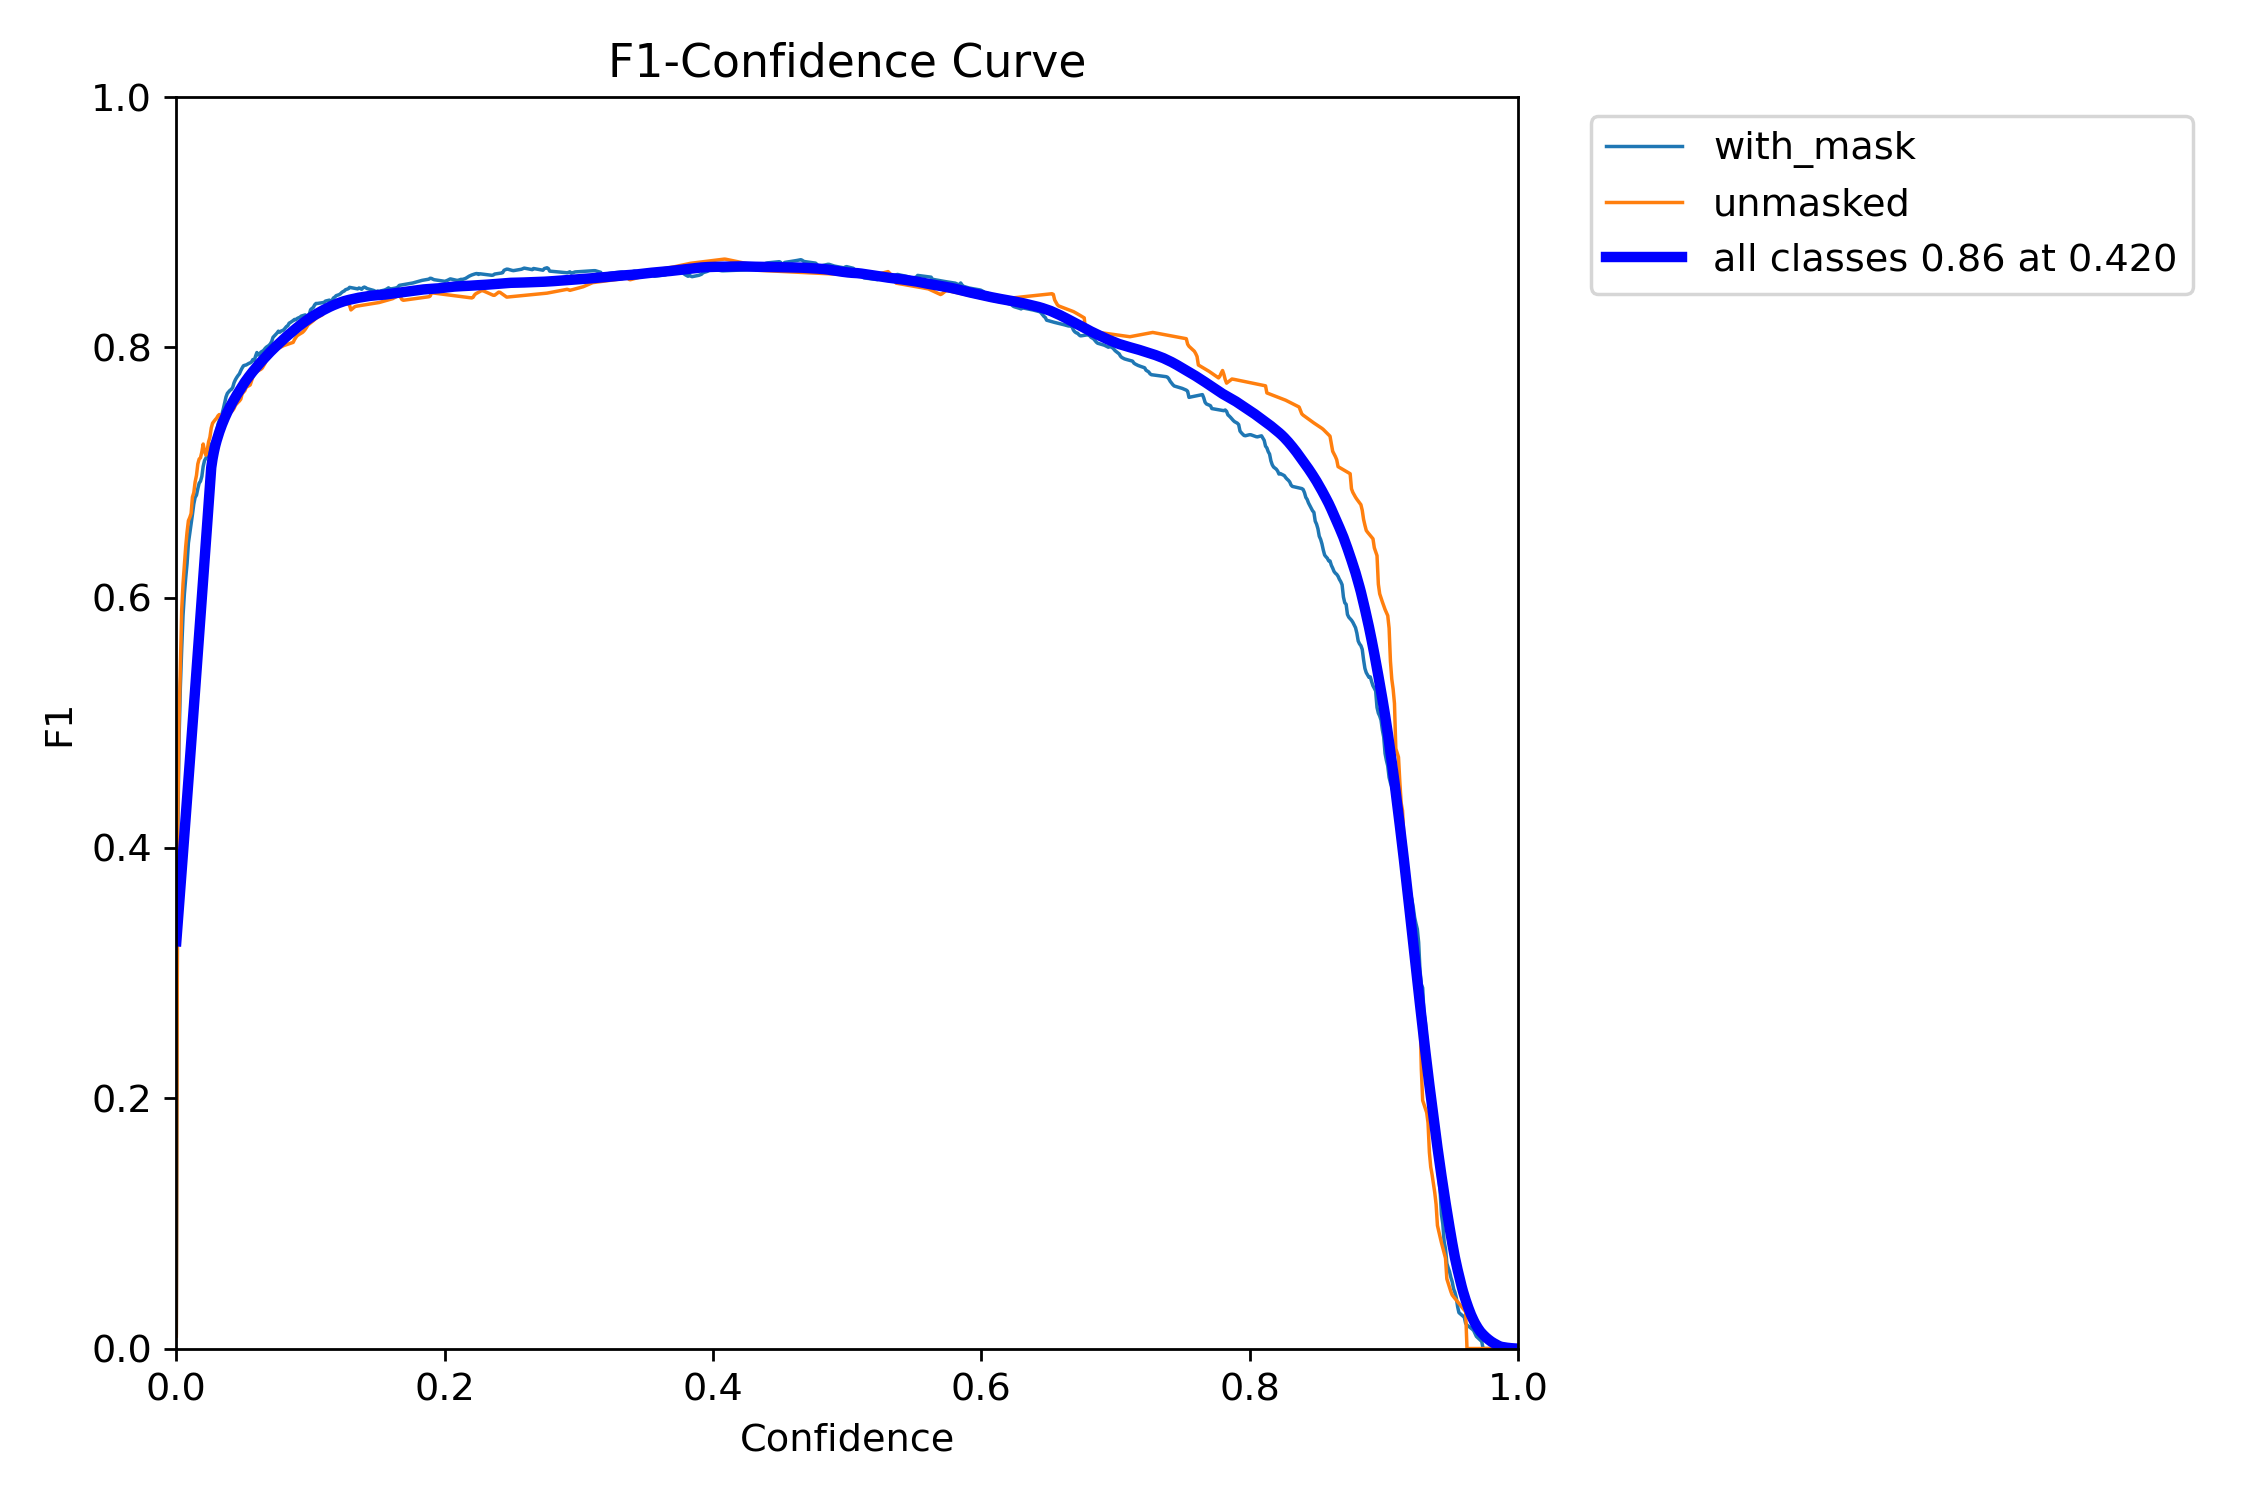
- The F1-Score represents the harmonic mean of precision and recall. This curve is crucial for selecting the optimal confidence threshold for deployment. Our model achieves its peak F1-Score of 0.86 at a confidence threshold of 0.420, providing the best balance between not missing objects and not making false detections.
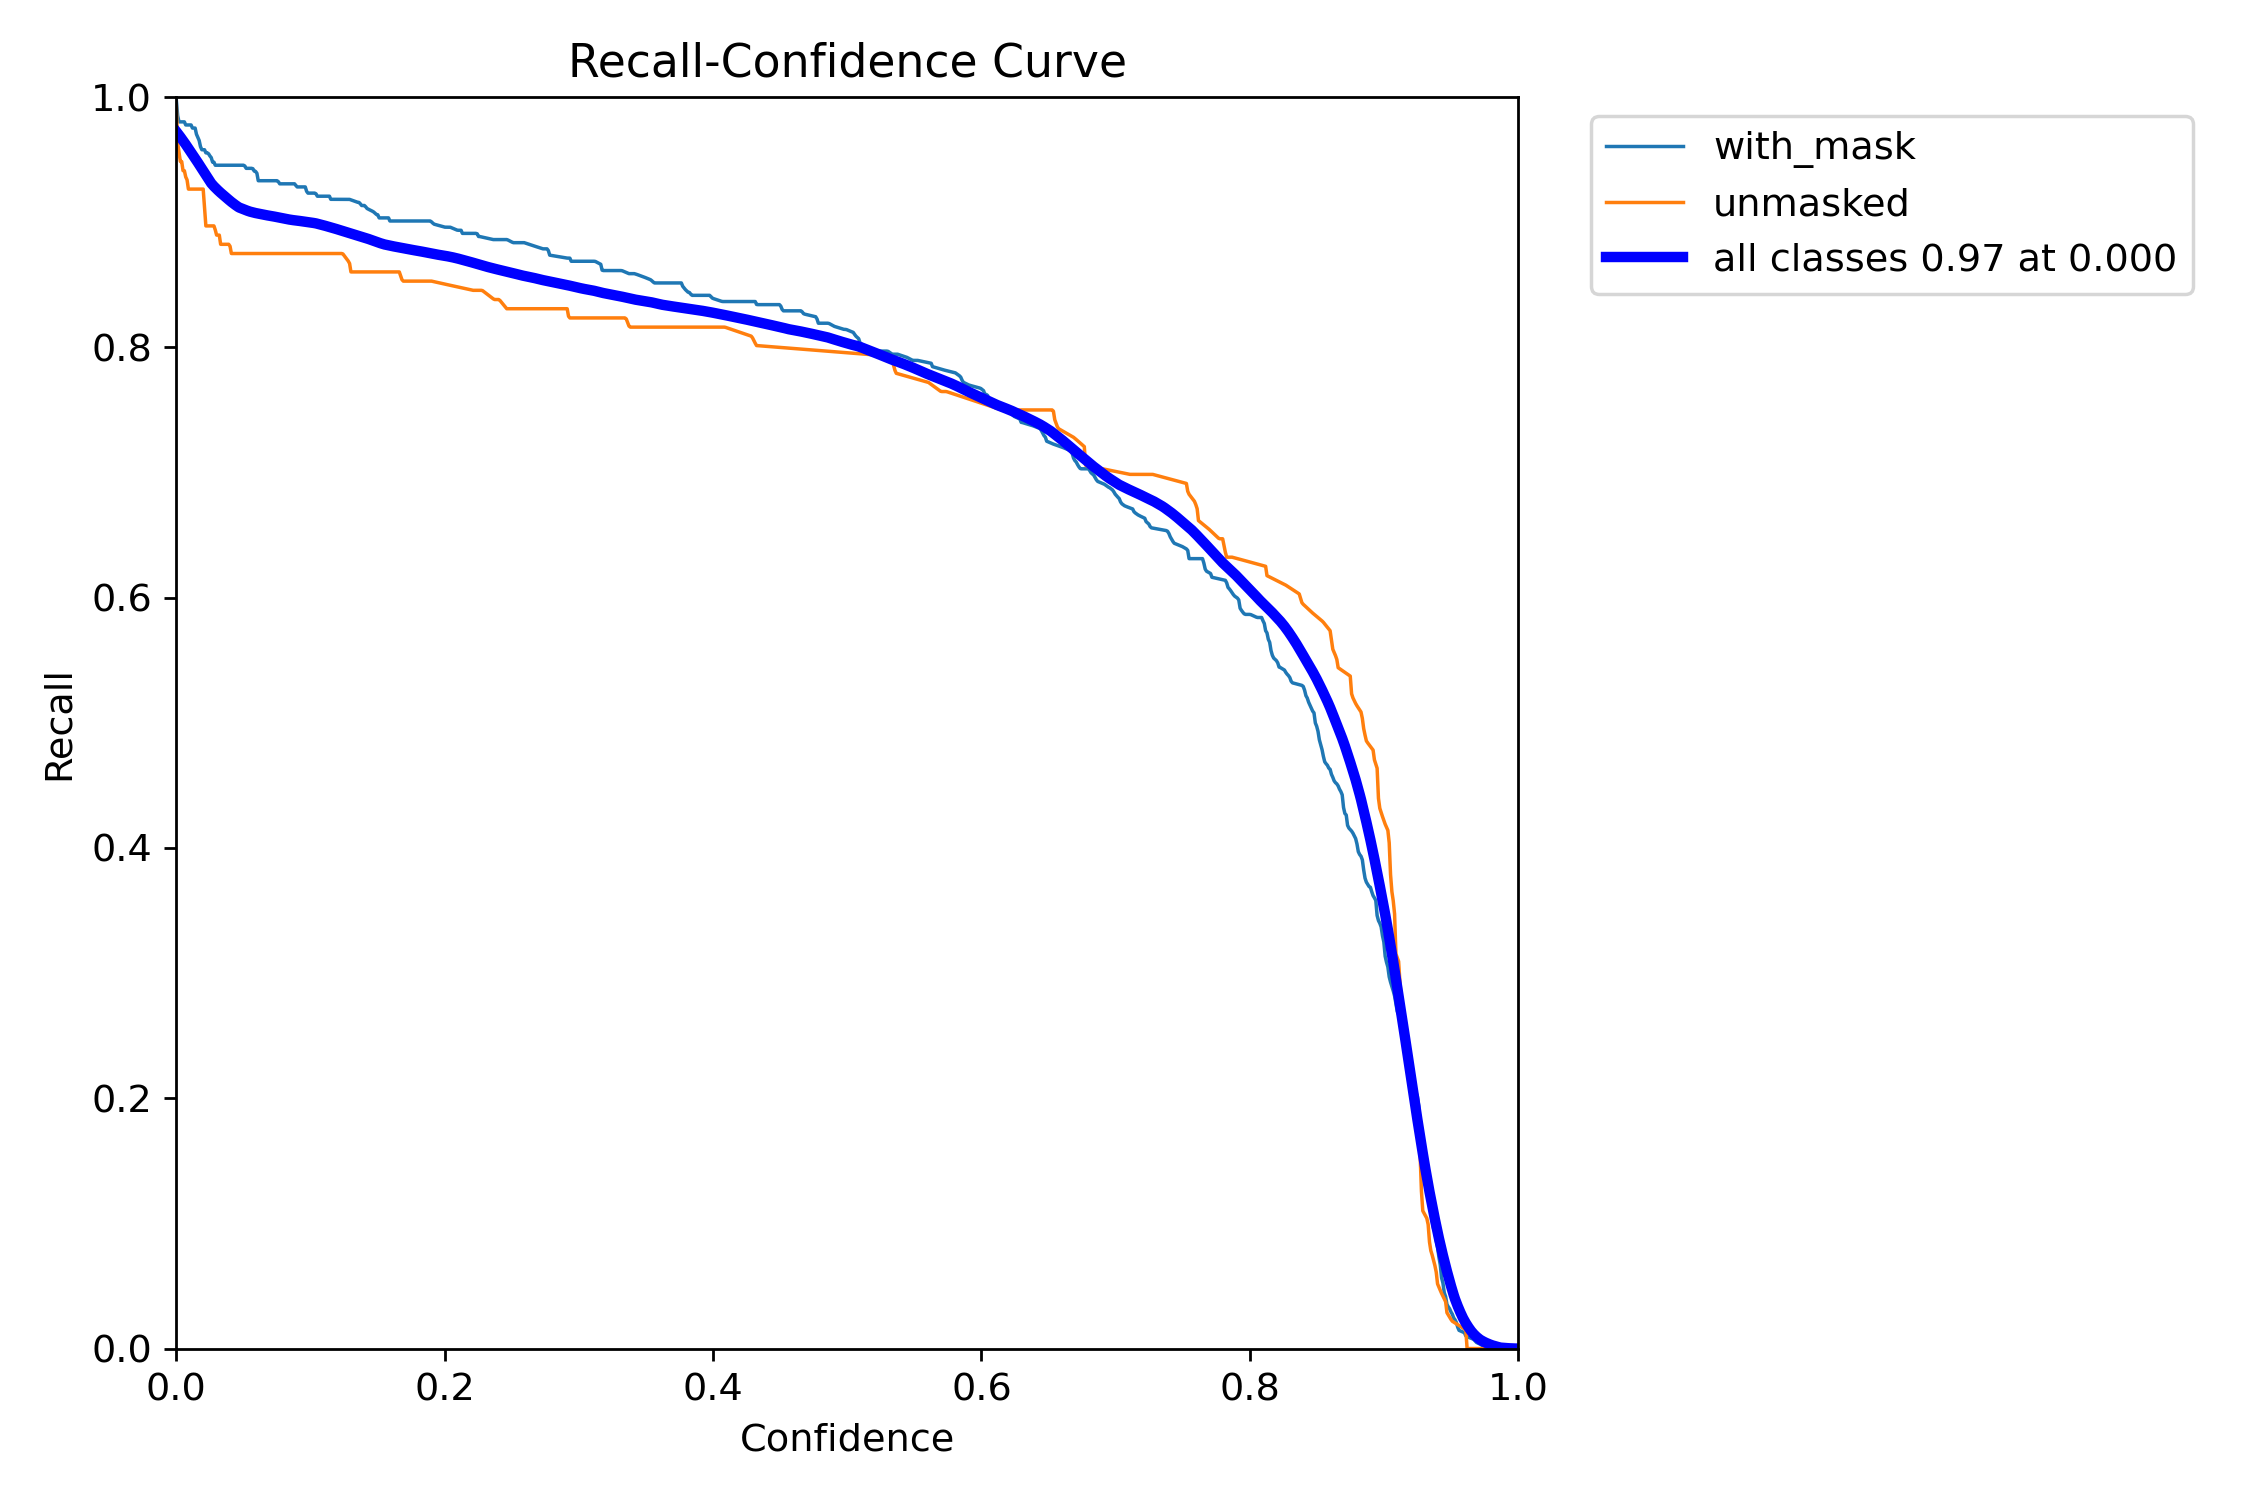
- This curve illustrates how recall is affected as we change the confidence threshold. It shows that we can still achieve over 80% recall even at a high confidence of ~0.7, demonstrating the model's reliability.
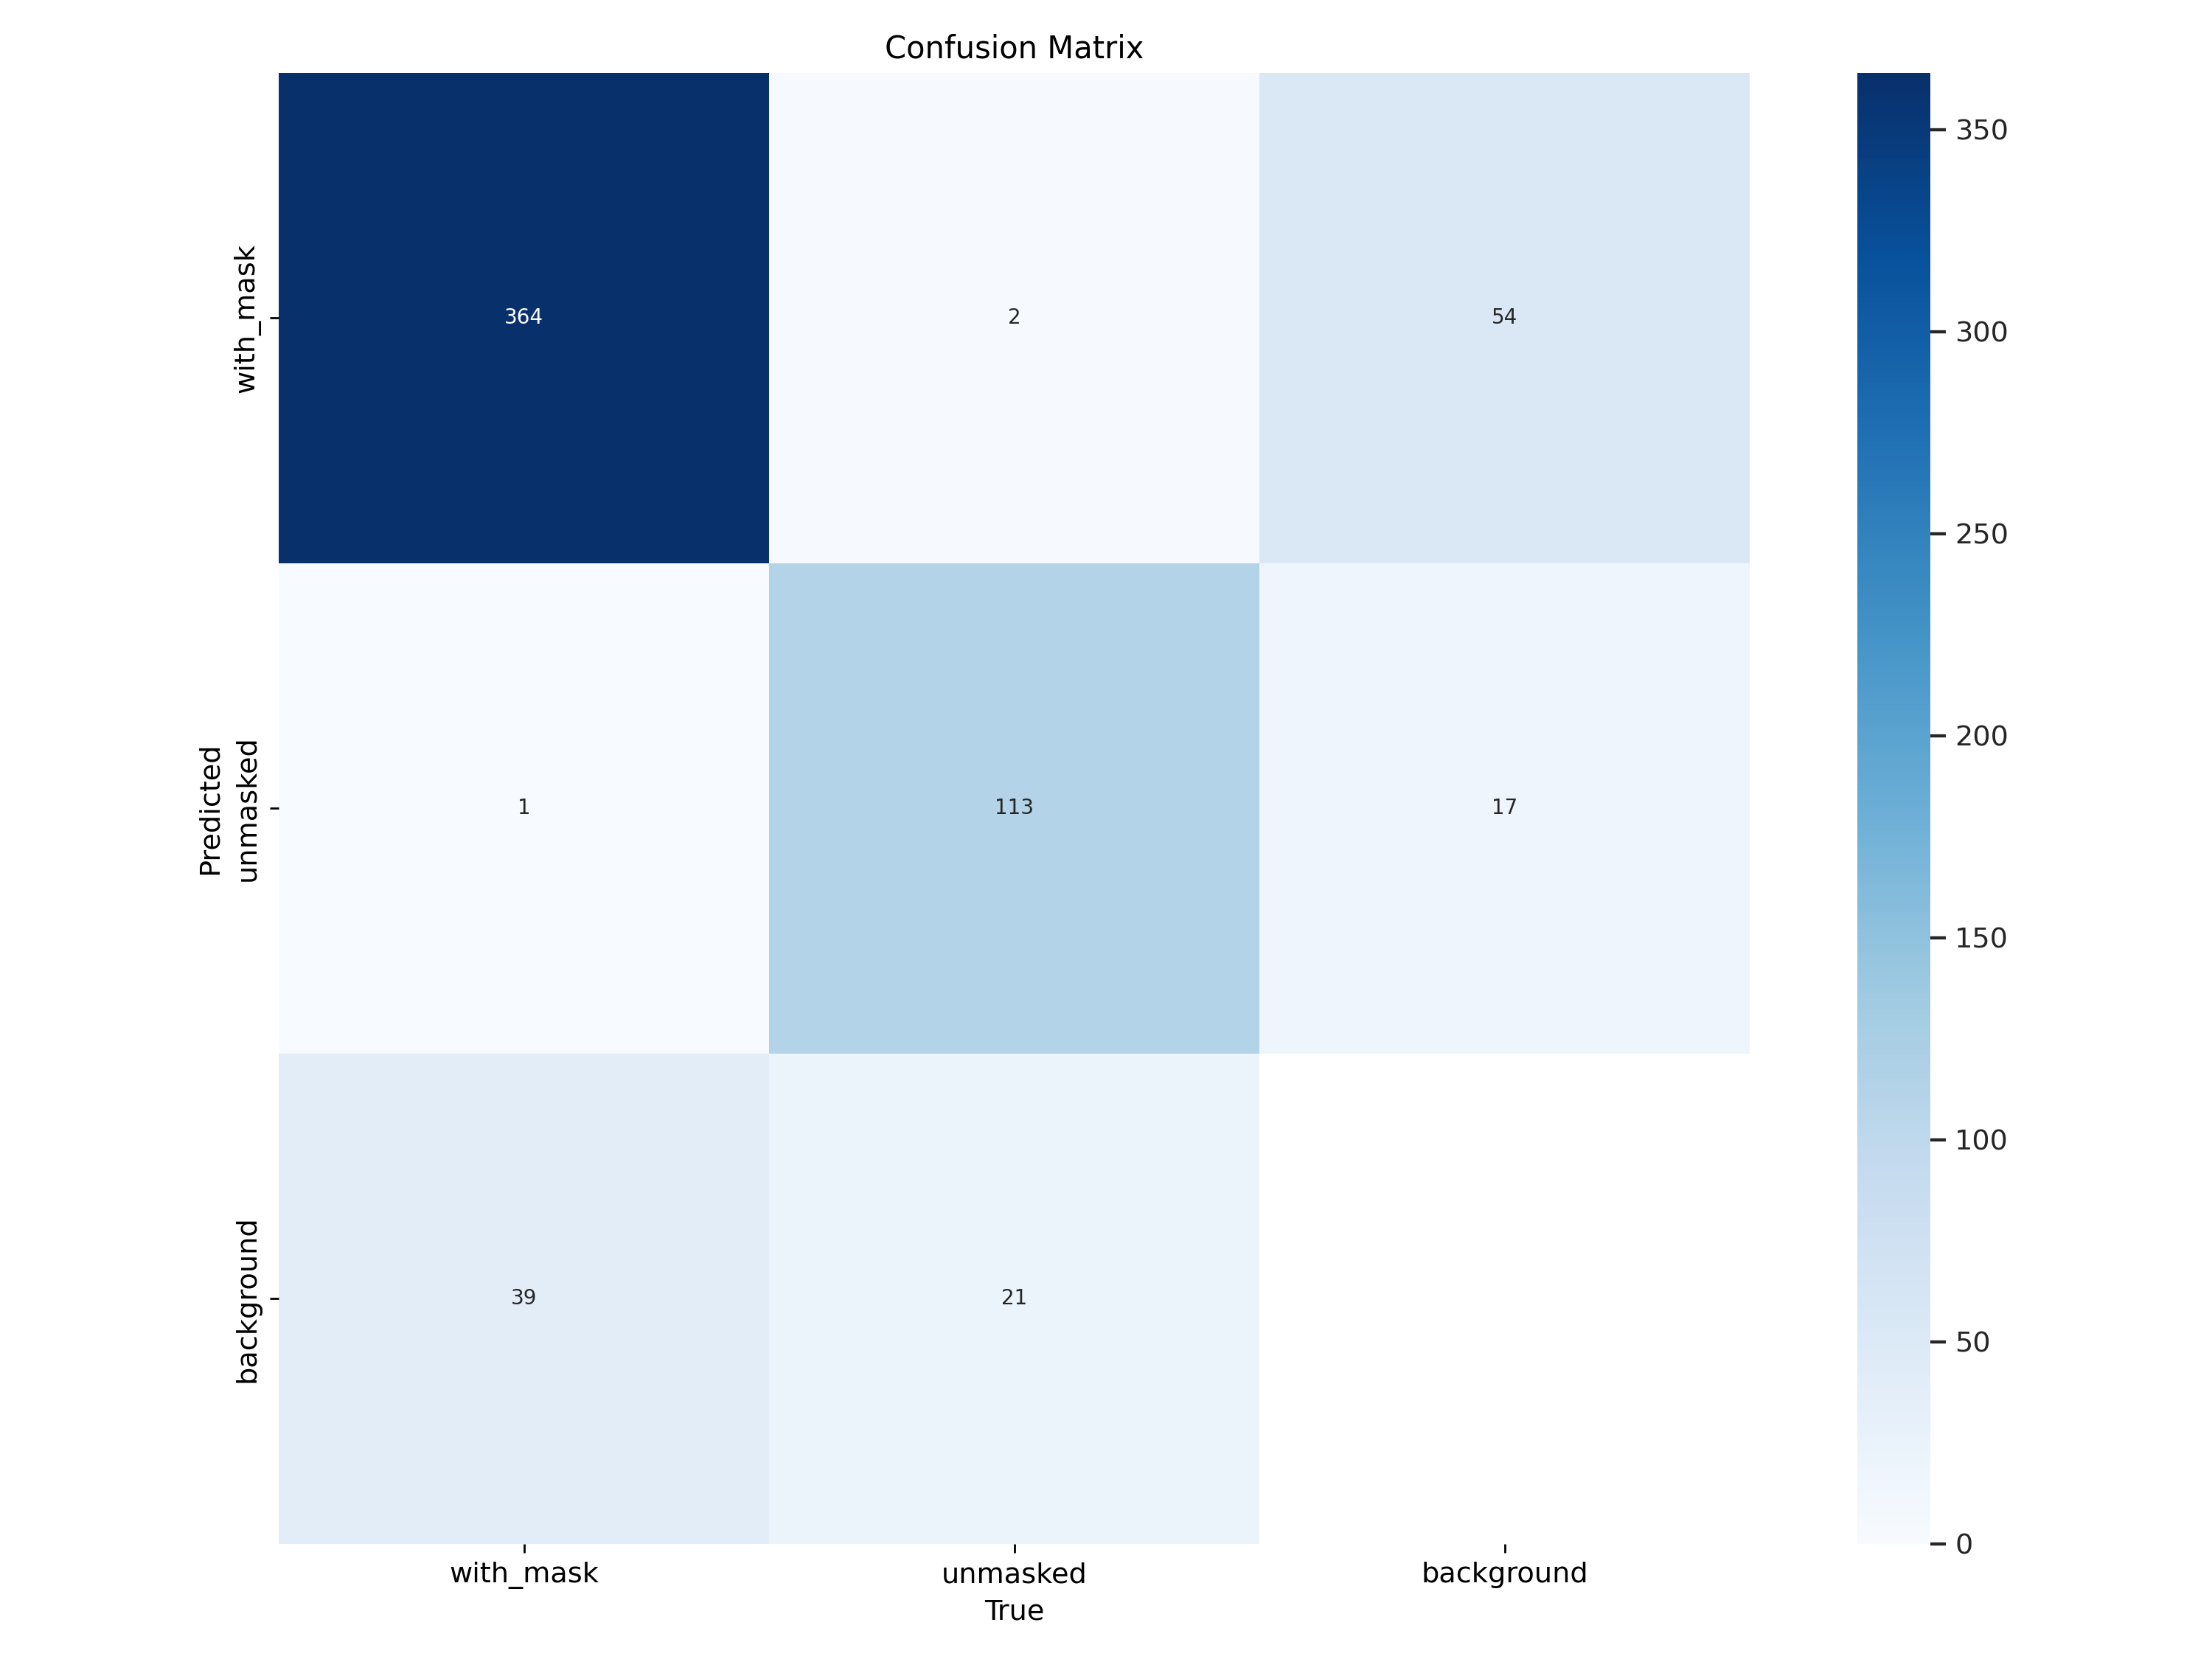
- The confusion matrix gives a clear, normalized view of the model's classification performance.
with_maskclass: Correctly identified 90% of the time.unmaskedclass: Correctly identified 83% of the time.- Primary Error: The model's main confusion lies in misidentifying the background as an
unmaskedperson (15% of the time). This is a typical challenge in object detection and suggests that adding more diverse background images (negative samples) could further improve performance.
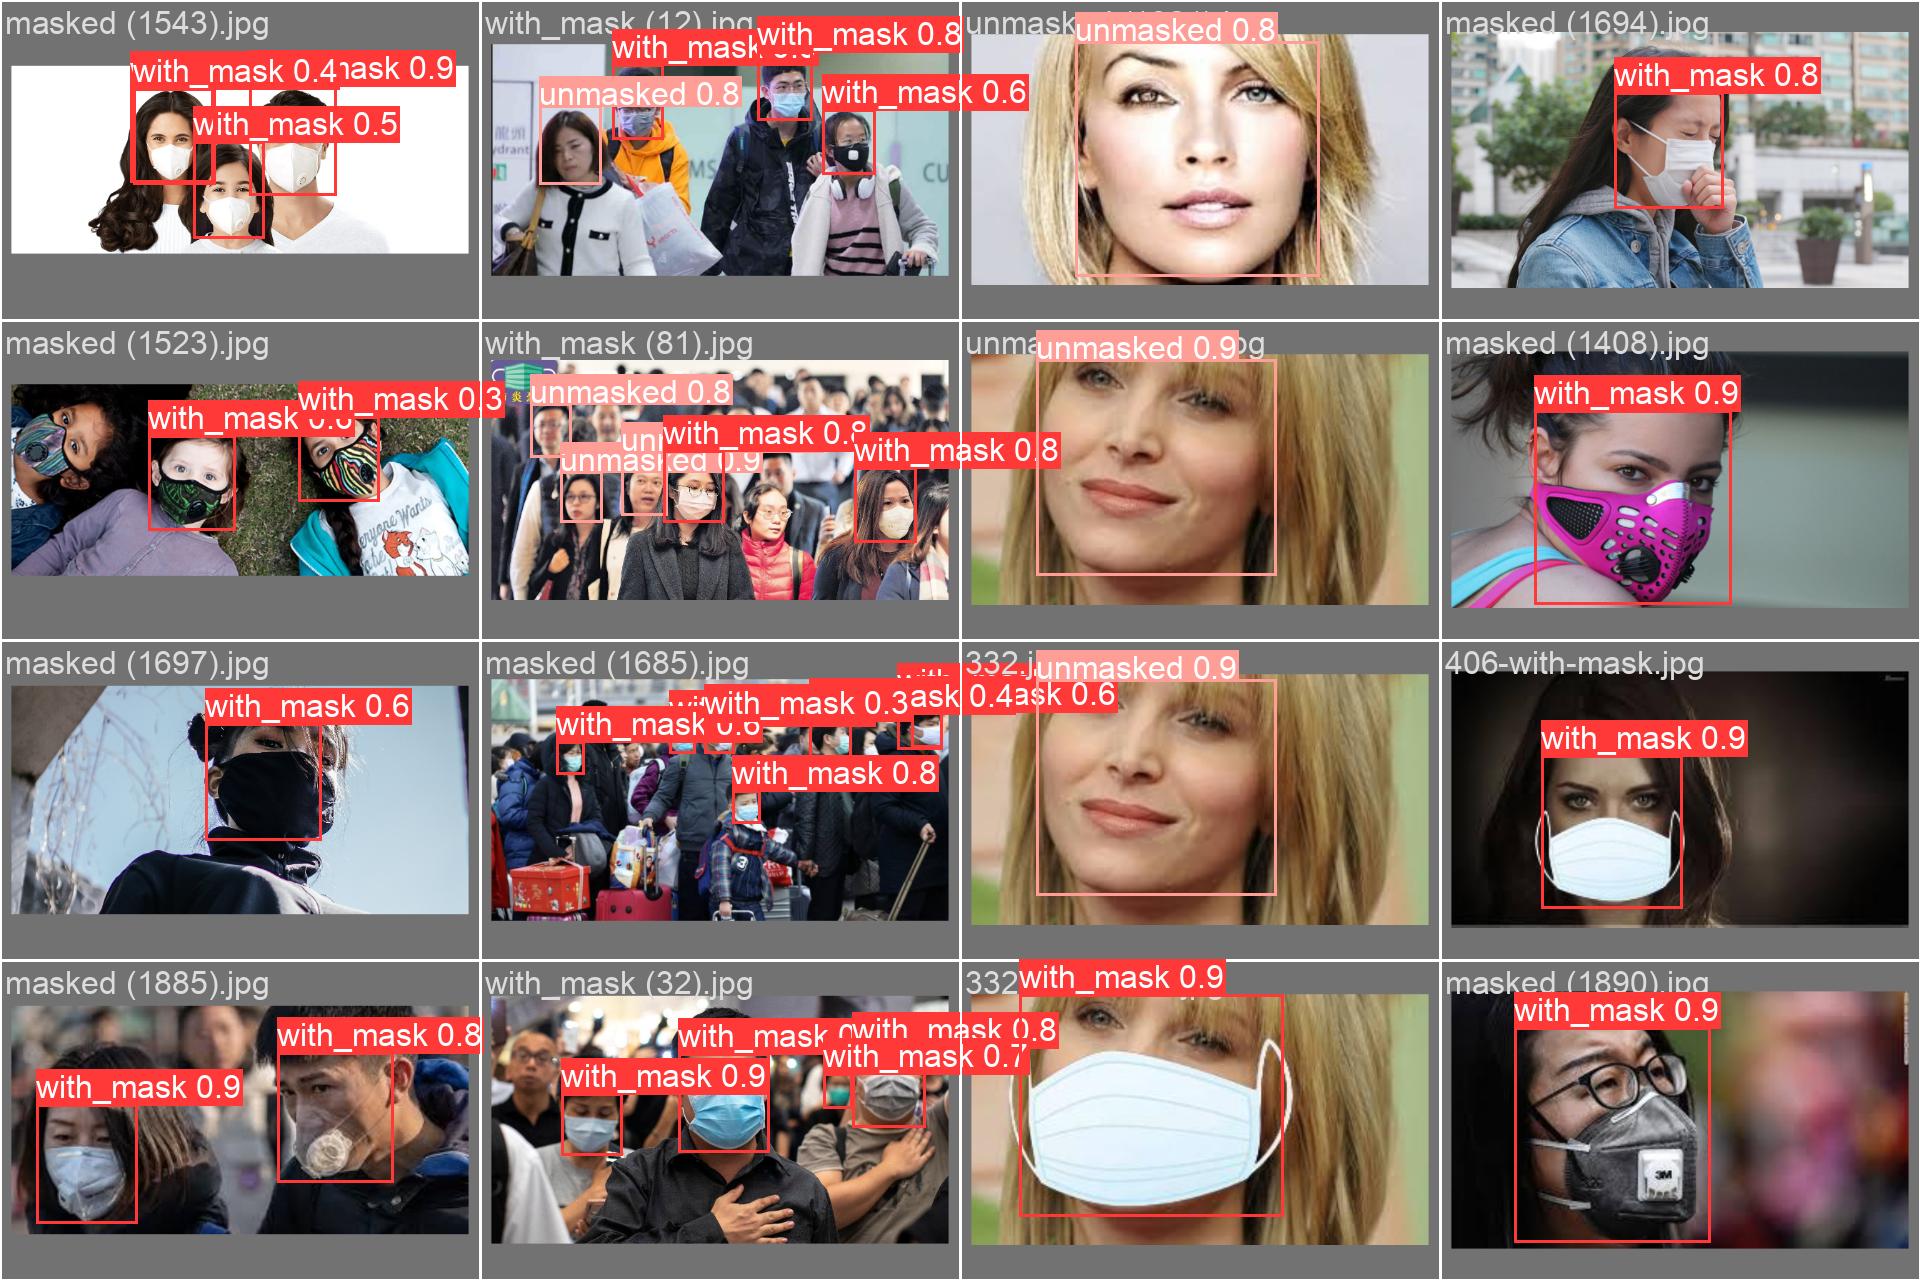
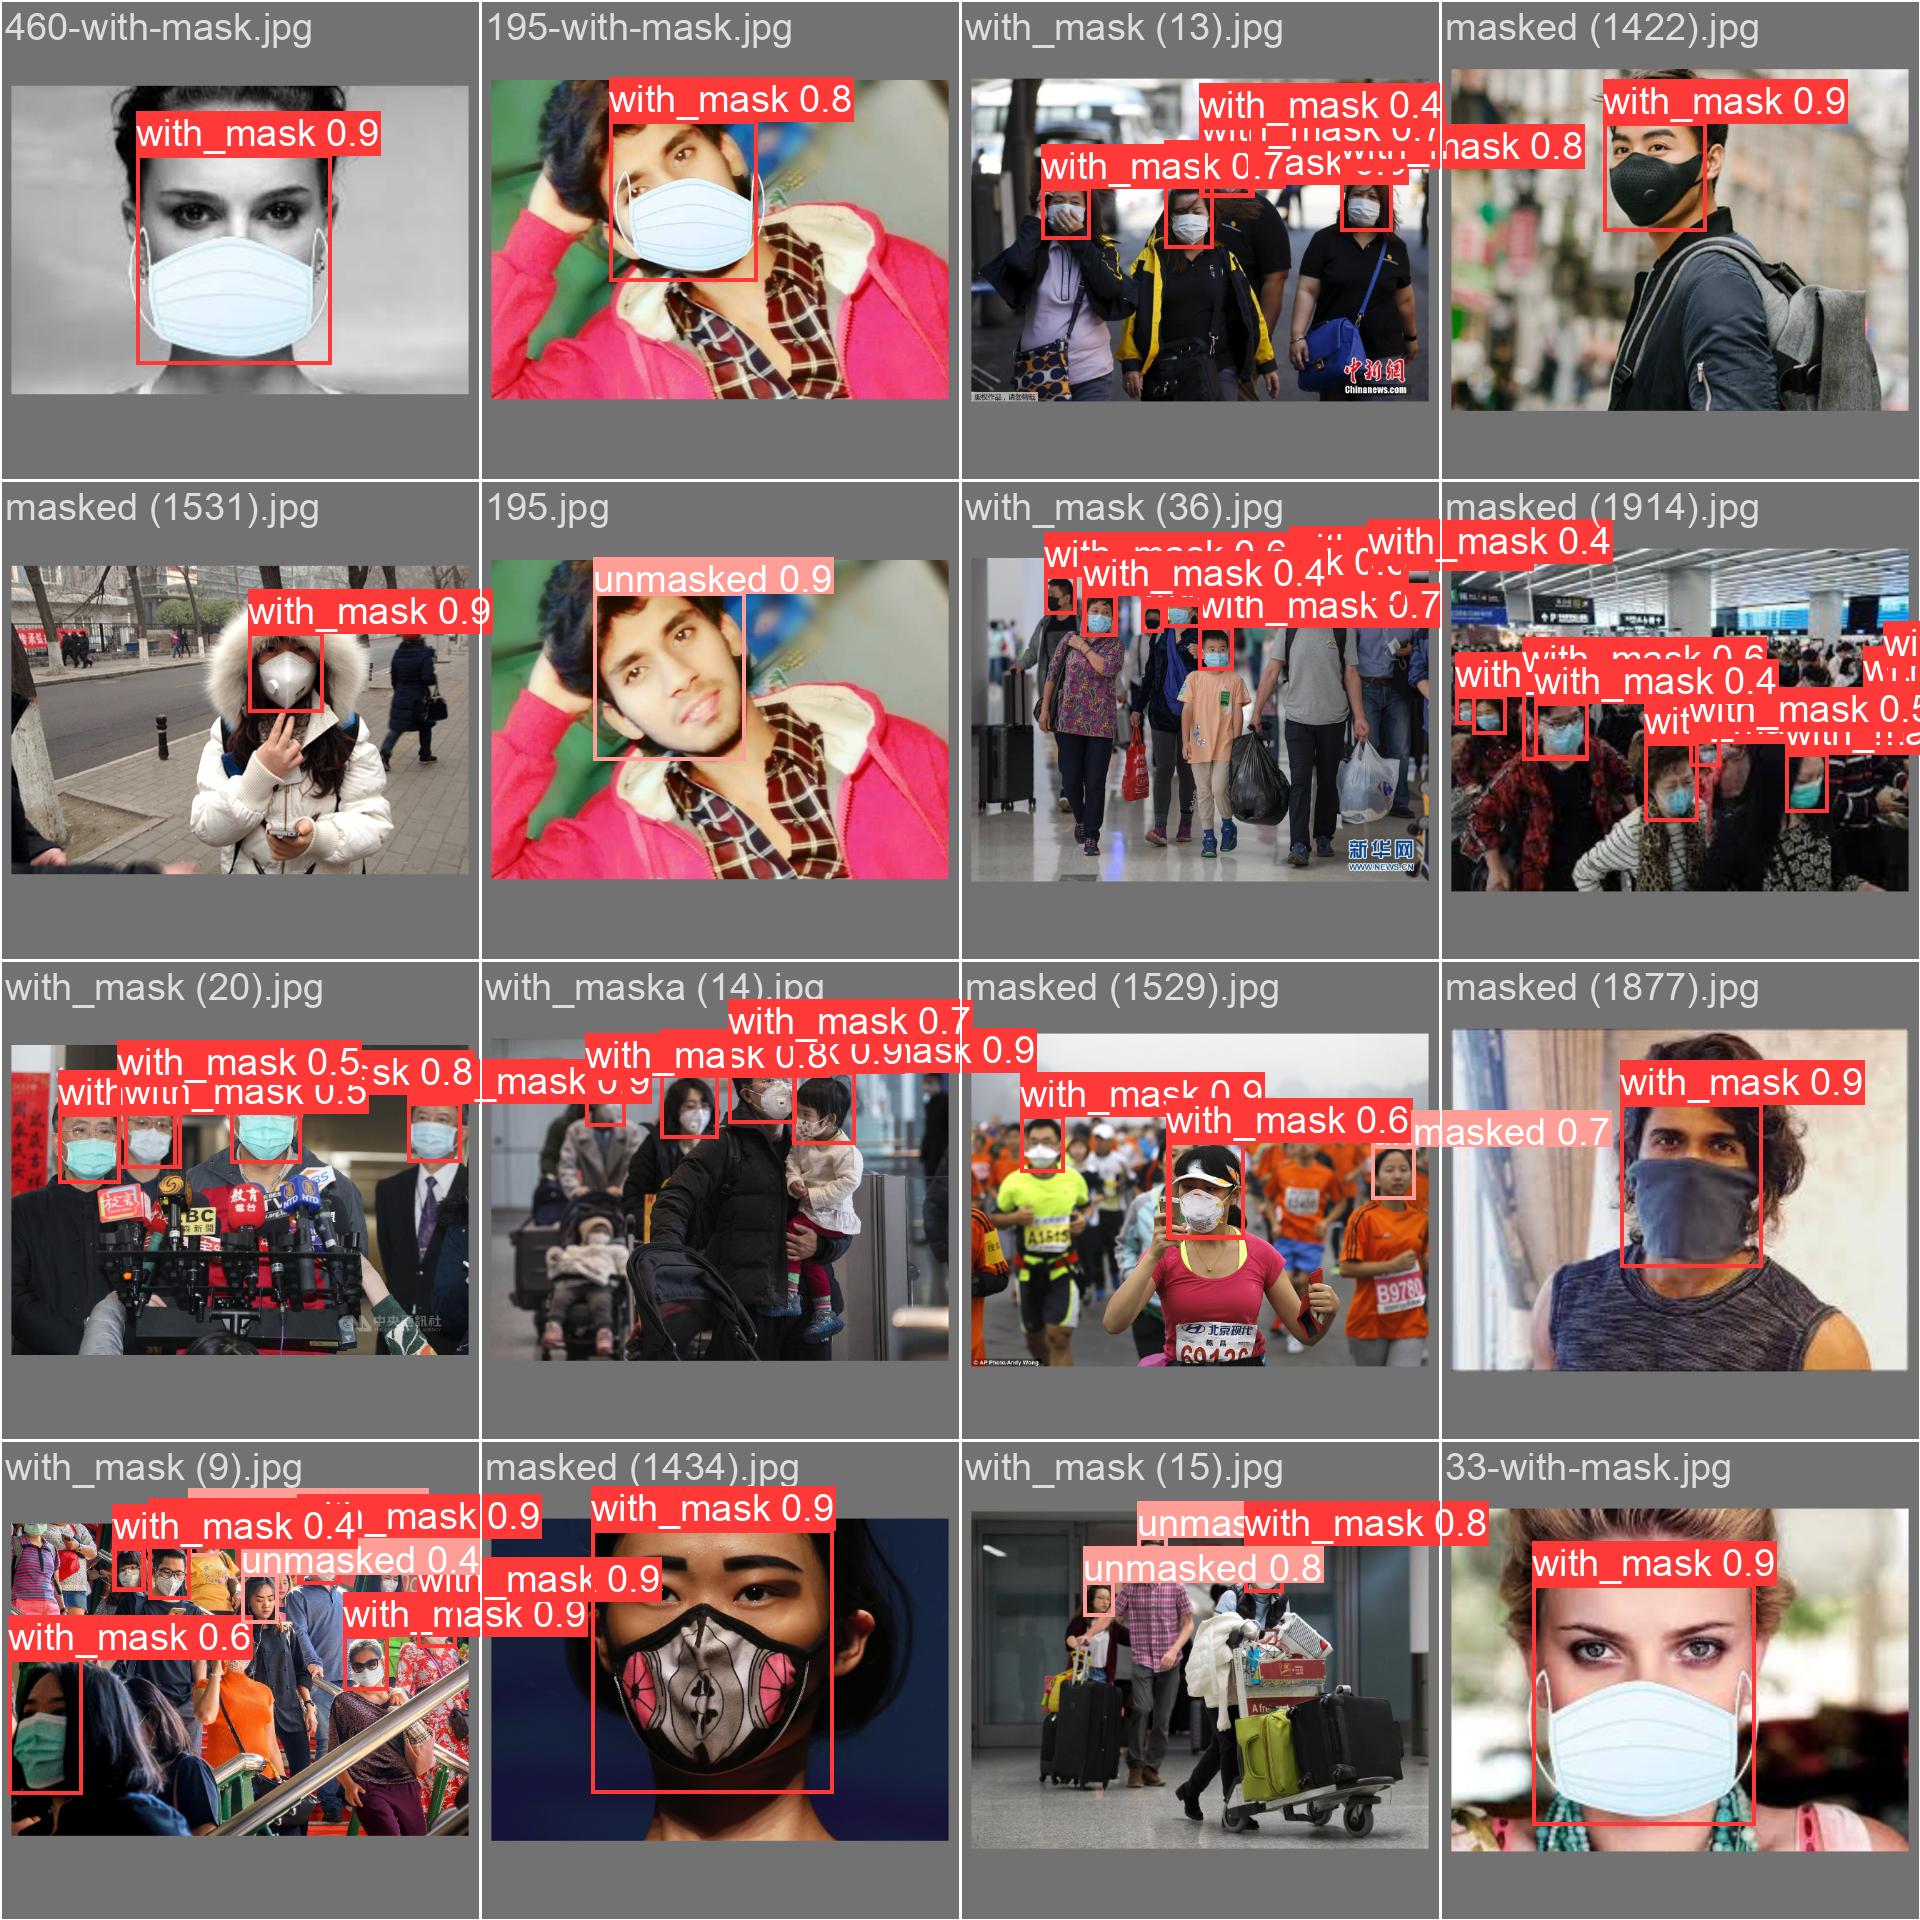
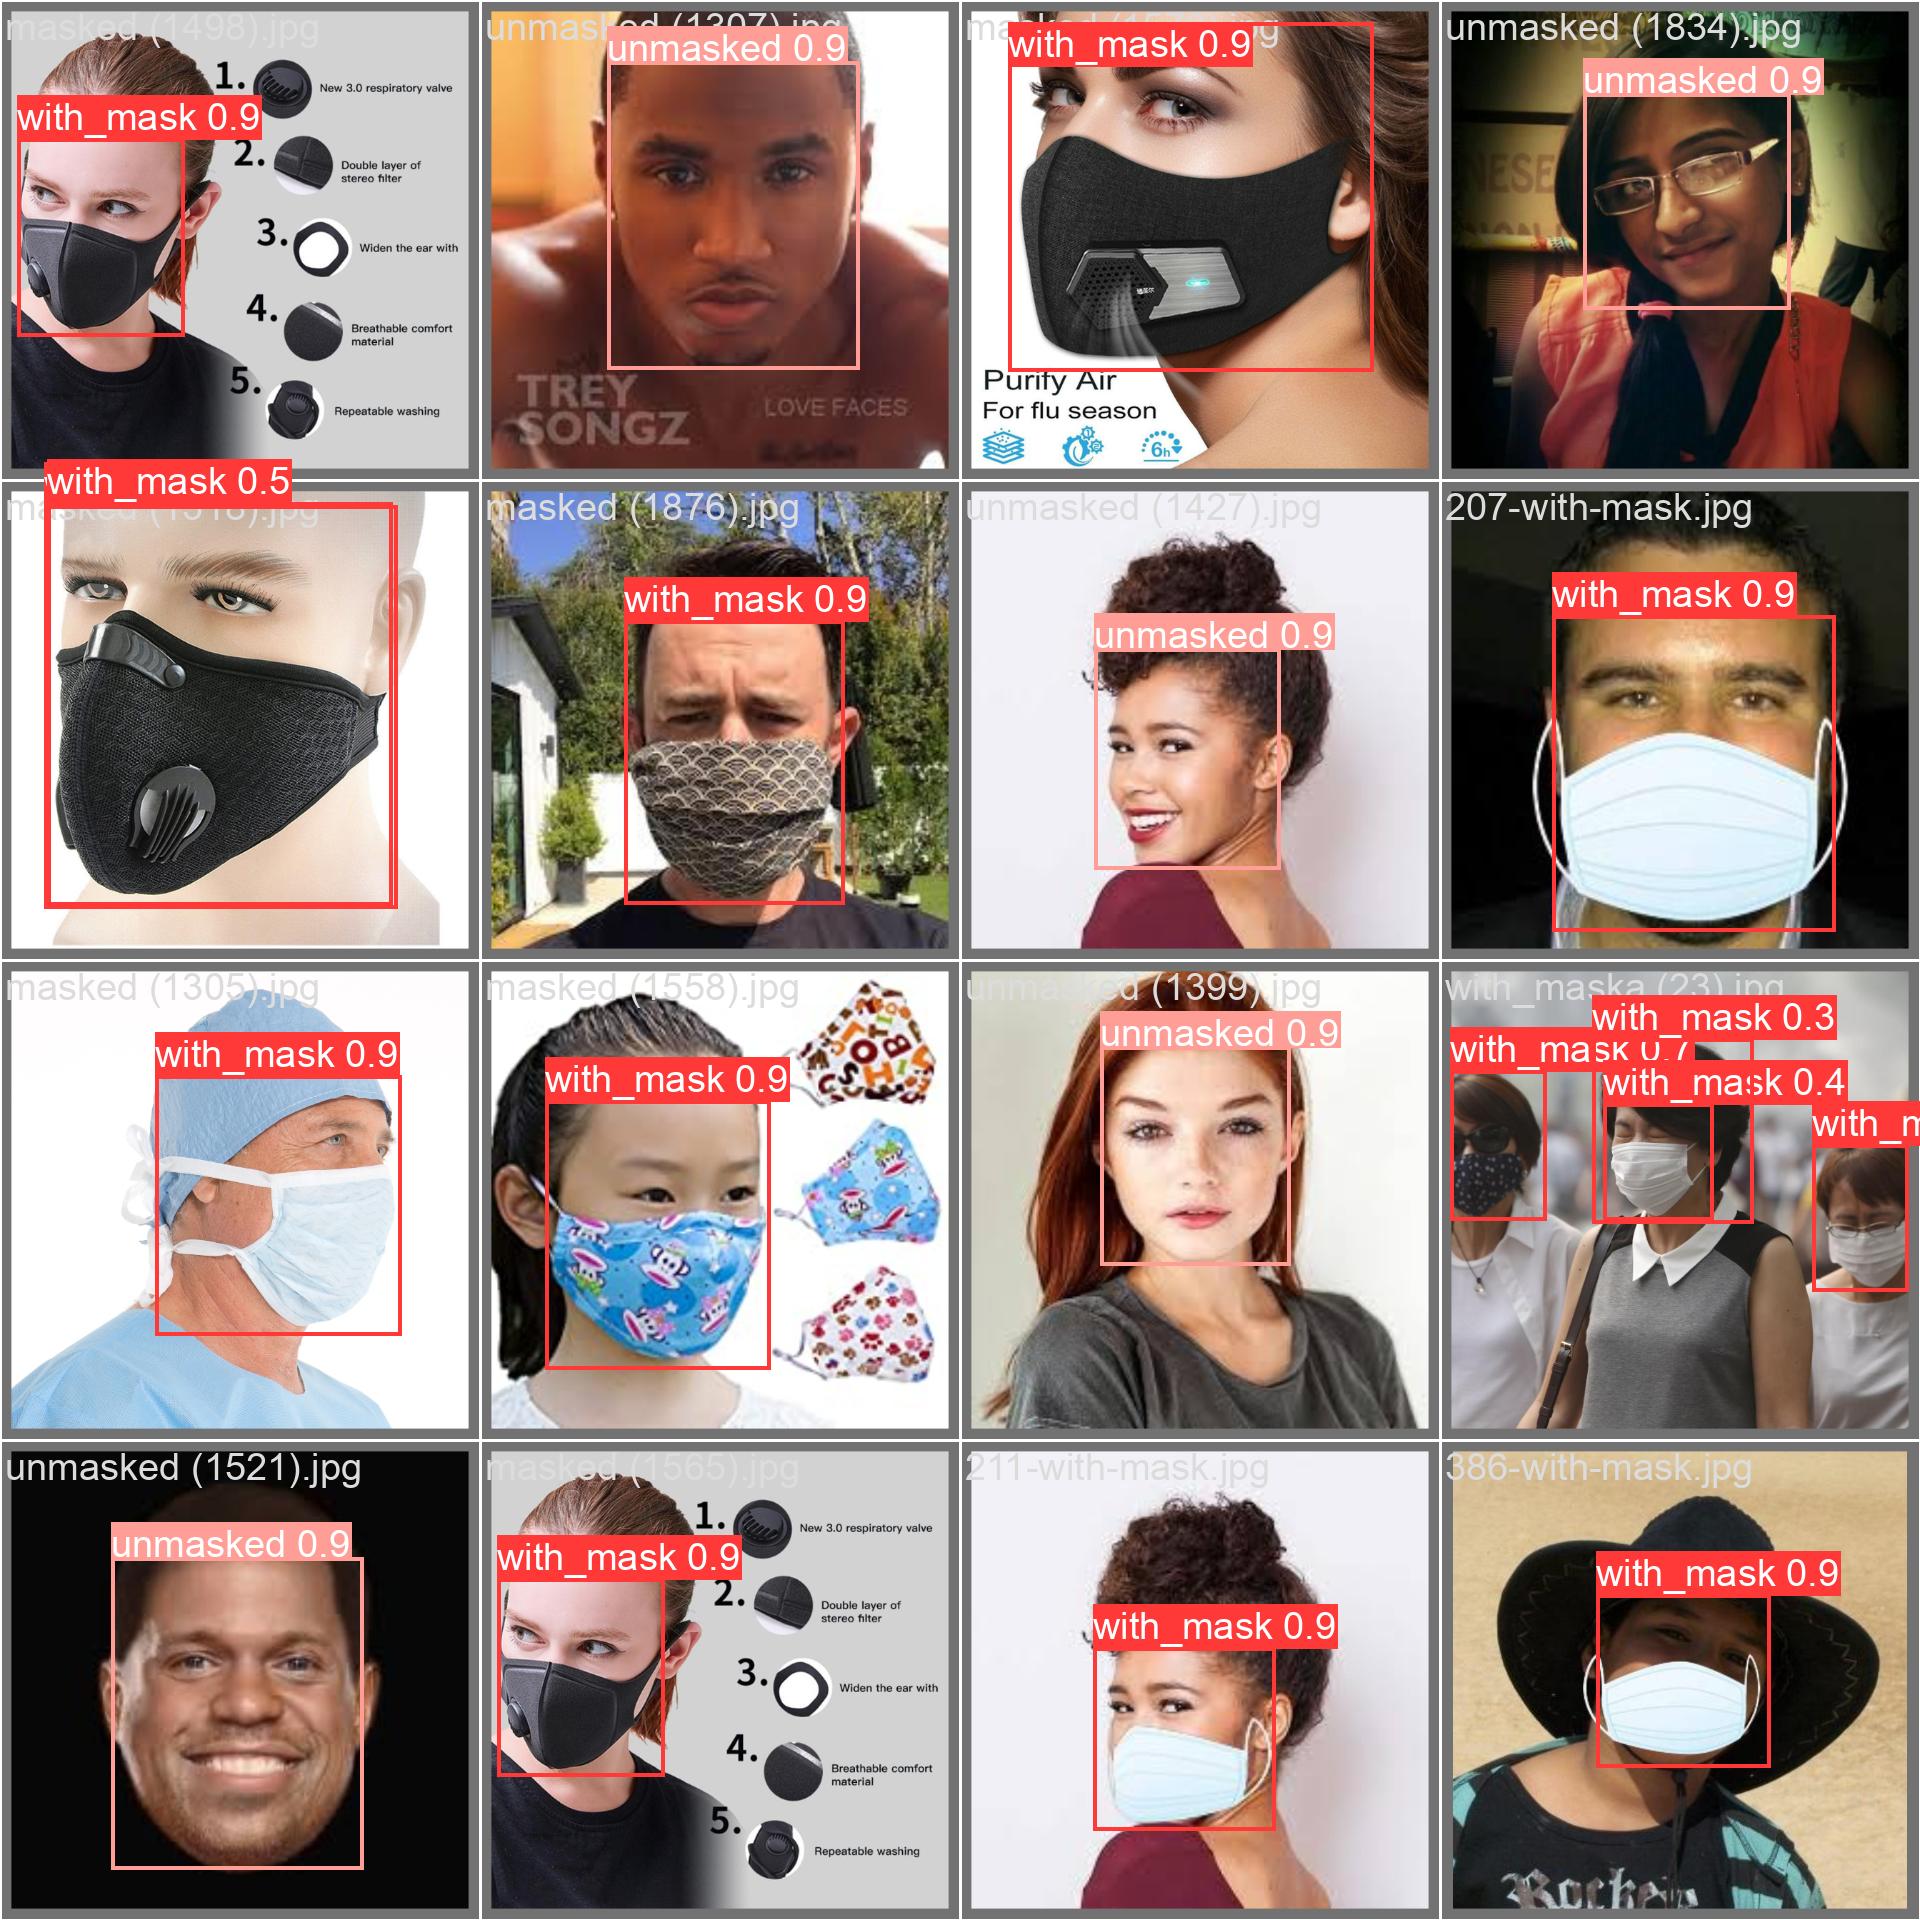
The following images are predictions from the validation set, demonstrating the model's robust performance on unseen data.
You can easily replicate the training process or run inference using your own data with the provided Google Colab notebooks.
- A Google Account (for using Google Colab and Google Drive)
- A video file or image for inference
To train the model on your own custom dataset, follow the steps outlined in the training notebook:
Notebook: Mask_Detection_with_YOLOv10.ipynb
- Set up Your Dataset: Organize your images and YOLO-formatted
.txtlabel files intotrain/,valid/, andtest/directories. - Configure
data.yaml: Create a YAML file that points to your dataset directories and defines your class names and number. - Upload to Google Drive: Place your dataset and YAML file in your Google Drive.
- Run the Notebook: Open the notebook in Google Colab, update the file paths, and run the cells sequentially to start training. The final weights (
best.pt) will be saved in your Google Drive.
To run inference on a new video or image using the pre-trained weights:
Notebook: Inference_Mask_detection.ipynb
- Upload Your Files:
- Upload your trained model weights (
best.pt) to your Google Drive. - Upload the video or image you want to test to your Google Drive.
- Upload your trained model weights (
- Run the Notebook: Open the inference notebook in Google Colab.
- Update Paths: Modify the cell for prediction to point to your
best.ptfile and your source video/image. - Execute and Download: Run the prediction cell. The resulting video with bounding boxes will be saved in the
runs/detect/predict/directory within the Colab session. You can download it directly from the file browser.
- This project is built upon the excellent work by the YOLOv10 authors at Tsinghua University. YOLOv10 Paper
- The training framework is powered by the Ultralytics library. Ultralytics GitHub