Bank Marketing & Insurance. The concepts of Clustering, CART, Random Forest, Artificial Neural Network are used to draw inferences from these case studies. Various performance metrics have been used to validate the performance of predictions on Test & Train sets.
Below is the cluster profiling with original data set and a freq column is added at last which tells us the total number of customers grouped under a specific cluster.
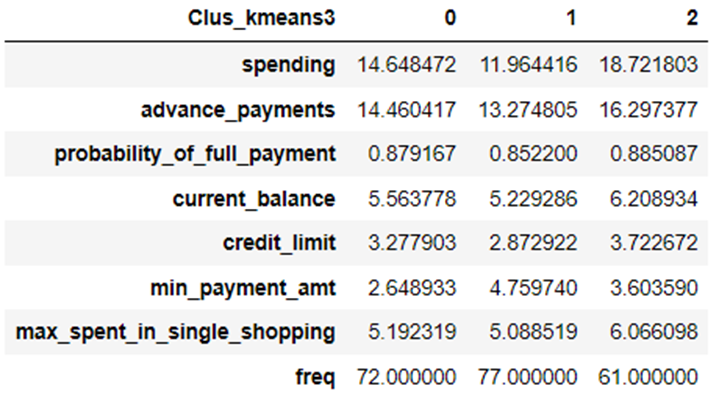 So here we have group by the clusters and taken the average of all the variable values. And taking average will not be affected as we have done the outlier treatment.
From the table cluster 0 has all the average values of all the variables with freq of 72 that means in cluster 0 total 72 customers are grouped. Similarly in cluster 1 total 77 customers are grouped and in cluster 2 total 61 customers are grouped.

Below is the table of comparison of all the three models with their train and test data.

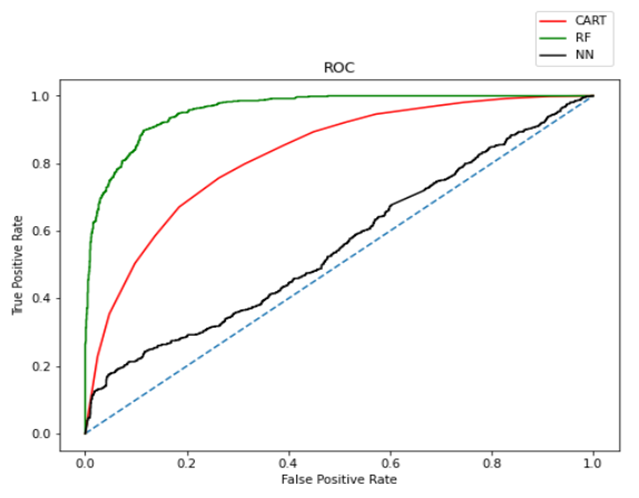

From the above two graphs we can clearly see’s that RF model has more Area under the curve as compared to CART and Neural Network models. So we will prefer RF model as it is looking best and optimized.