Getting Started
Audio analyzers are complex devices with a lot of settings, and many settings will often change the results of a measurement. The aim of this guide is to get you making basic, meaningful measurements quickly, and also as a go-to guide to verify that your QA402 or QA403 (collectively referred to as the QA40x hardware) is operating as expected.
There are some additional pieces you are going to need use your analyzer. Because most of what you are testing will require some sort of custom connector to connect between the QA40x hardware and your Device Under Test (DUT), we don't provide cables. We also don't provide a USB cable, because anymore most have plenty of USB cables and additional cables just end up in the trash.
Some common accessories you will need:
The analyzer has differential inputs for both the left and right channels. Shorting blocks are used to short the unused INPUTS on the audio analyzer. For example, if you want to make a single-ended measurement on the L+ input, then you need a shorting block on the L- input. NEVER connect a shorting block to the outputs of the analyzer as it can overheat the output opamps and that could cause a shift in performance.
There are generally two types of shorting blocks: 50 ohms or 75 ohms. Either will work. They are commonly used for terminating CCTV equipment. A picture of some BNC shorting blocks sold on Amazon are below:
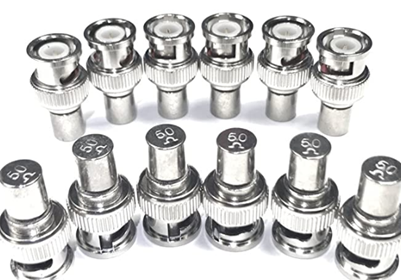
You will need at most 4 of these, but they are inexpensive and they will eventually "wear out" and deliver an intermittent connection. So, look for a deal where you are buying 10 at a time. They are handy to have around.
The QA402 uses BNC inputs and outputs. For loopback tests, you might want some short and very flexible BNC cables. These can be useful for patching between the QA40x hardware and other QuantAsylum equipment (such as the QA451). The 6" length works well for loopback and also when the QuantAsylum equipment is stacked atop each other. At audio frequencies, you don't need thick coax. Long, thick cables are tougher to bend around a tight radius. Look for cables with a <3mm diameter.
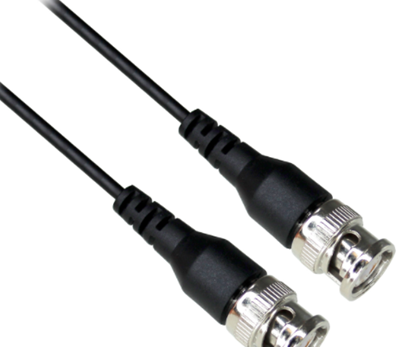
For single-ended loopback tests, you will need 2 of these (4 for balanced).
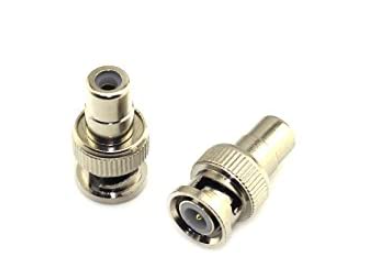
The QA402 and QA403 hardware can be adapted to XLR via adapters. In an XLR connection, Pin 2 and Pin 3 carry the signals. The signals are balanced, meaning they are 180 degrees out of phase. If you wanted to take the QA40x hardware output to an XLR connector, you'd take the L+ output and connect that to Pin 2 of the XLR, and the L- output and connect that to Pin 3 of the XLR. And the BNC shells (which are all connected together) would be Pin 1 on the XLR connector.
To manage this, you could either build your own cable, or you could use off-the-shelf cables. For example, you could use a BNC to RCA adaptor (commonly sold on Amazon):
And then, use a RCA to 1/4" TRS. The cable below (also available on Amazon from many suppliers)
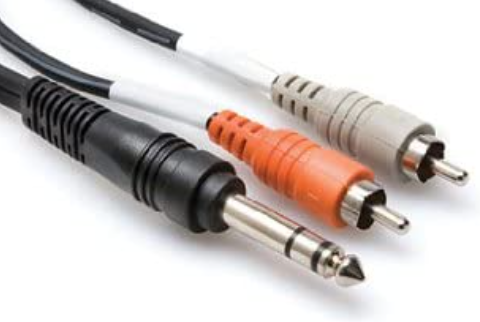
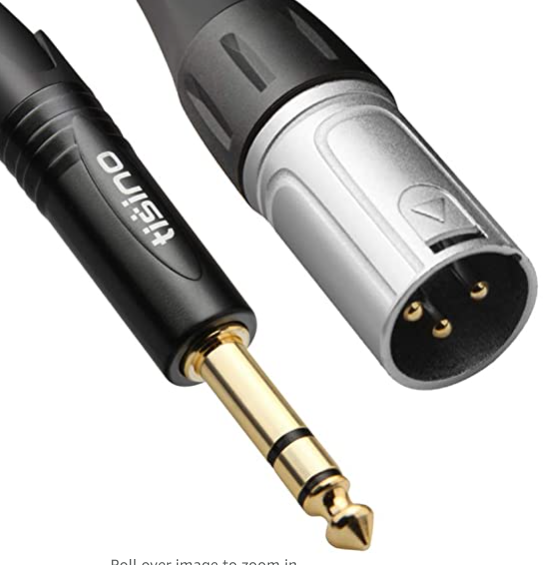
The 1/4" TRS is commonly used for patchbays, so it's straightforward to go from 1/4" TRS to XLR:
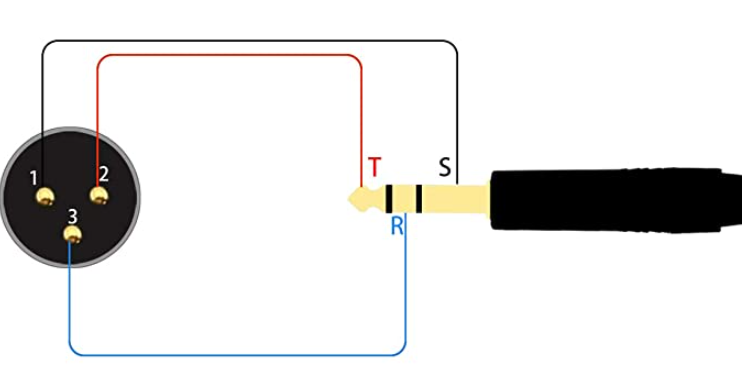
When looking at cables, it's important to make sure the balanced signals are preserved. Some cables will sometimes short the Pin 3 connection. You want to make sure the cable preserves the balanced signals as shown:
The QA402 pulls around 800 mA of current over the USB connection. You want to minimize the drop across the USB cable, and that means you'll want what is normally called a "heavy duty USB cable." Often, you'll see the wire gauges written on the side of the sleeve. Look for cables that are 24 gauge for the power conductors. As with the BNC shorting blocks, Amazon is a good place for these 24 AWG cables if you don't already have some.
The QA40x application will report the measured USB voltage in the status bar. When the voltage is too low, you'll see the USB voltage reported with an orange background (borderline) or red background (too low). It's OK to use with the analyzer if your USB voltage is too low, but some measurements that rely on large signal swings might be invalid.
A hub probably isn't needed, but a powered hub is an easy way to ensure you are supplying the QA40x with enough current AND it also makes it easy to add more USB-powered test equipment down the road. We use these 14-port USB Hubs.
With the cabling sorted out, let's move on to your first connections.
After you have installed the QA40x software (latest release is here), you can plug in the QA402 or QA403 hardware to your USB connection. The QA40x is a driverless install--Windows won't need to install a driver to "talk" to the hardware.
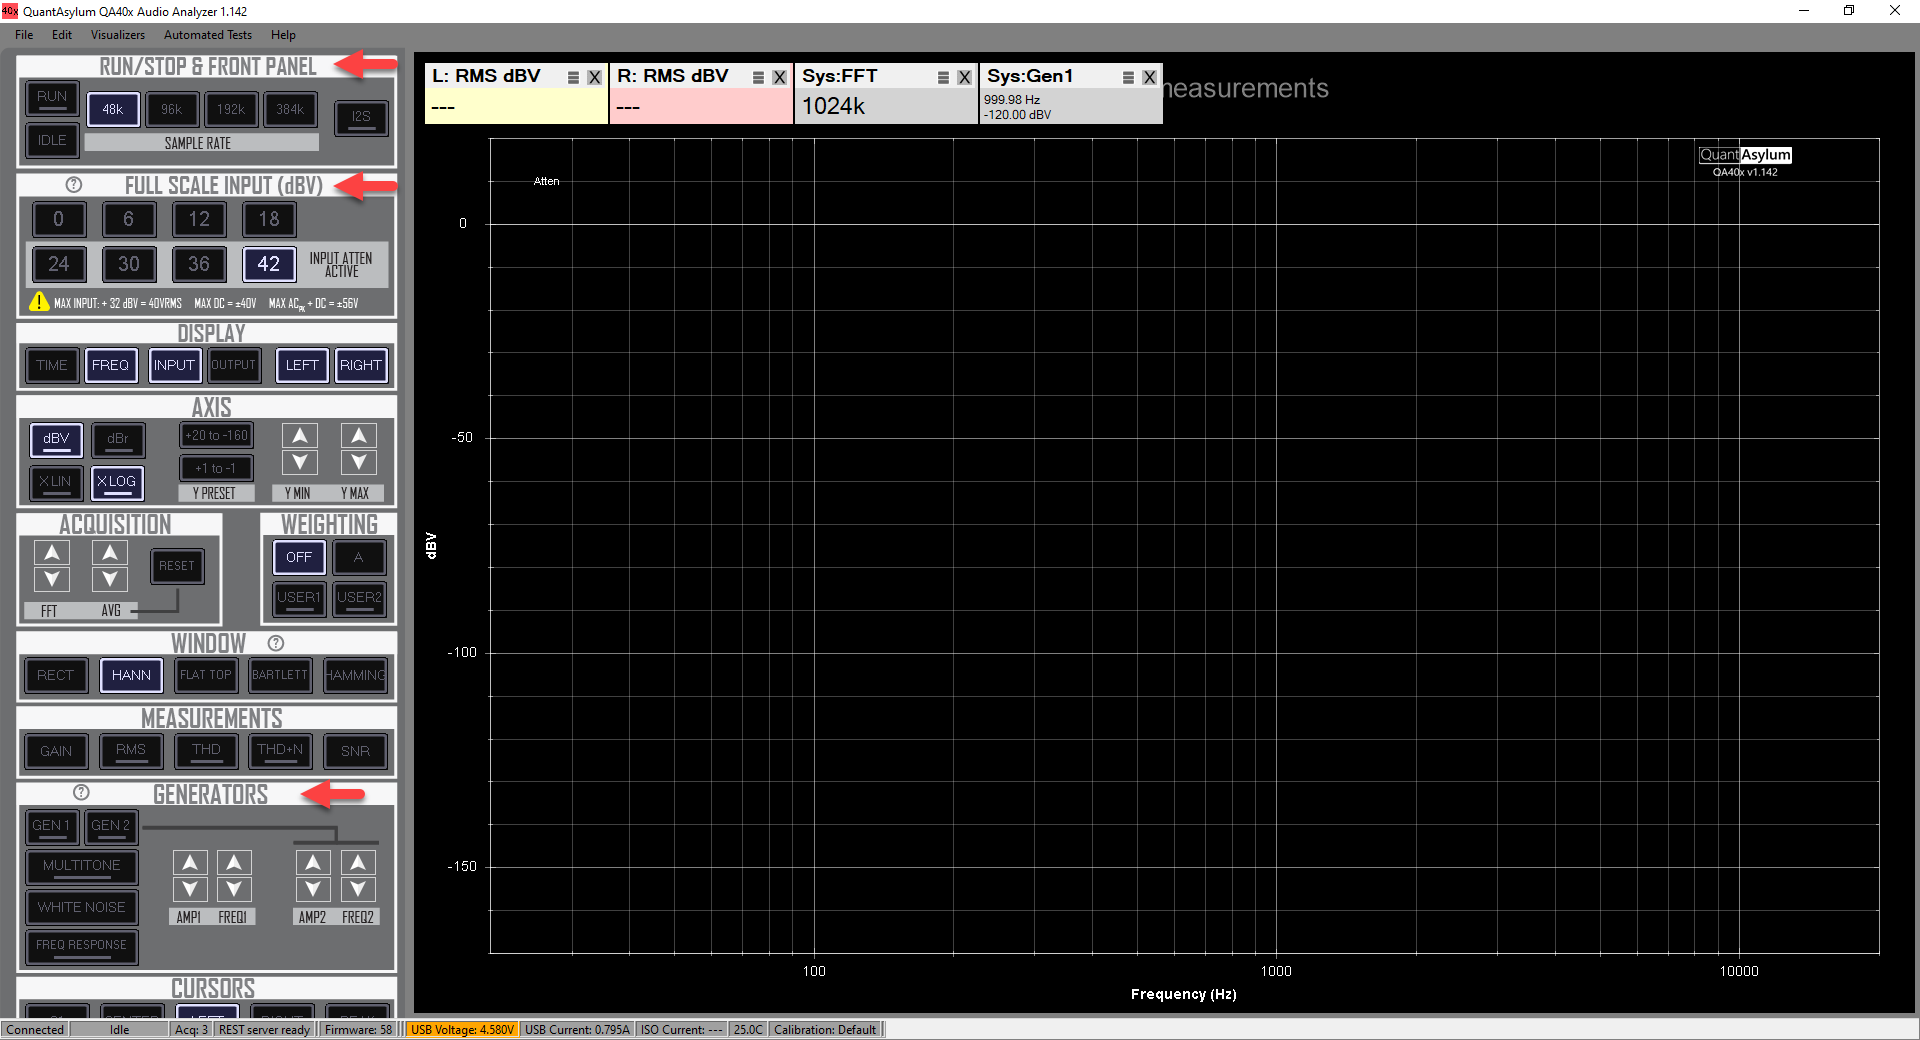
After connecting the QA40x, you'll want to check out the application to ensure it connected. This will be shown on the lower left side of the application. Note that in the documents below, you might see mentions of a button, along with a small graphic. For example, if you see Idle, this indicates the button in the application that is labeled "Idle". In the screen shot below, the Idle button is in the "Run/Stop Front Panel" control group:
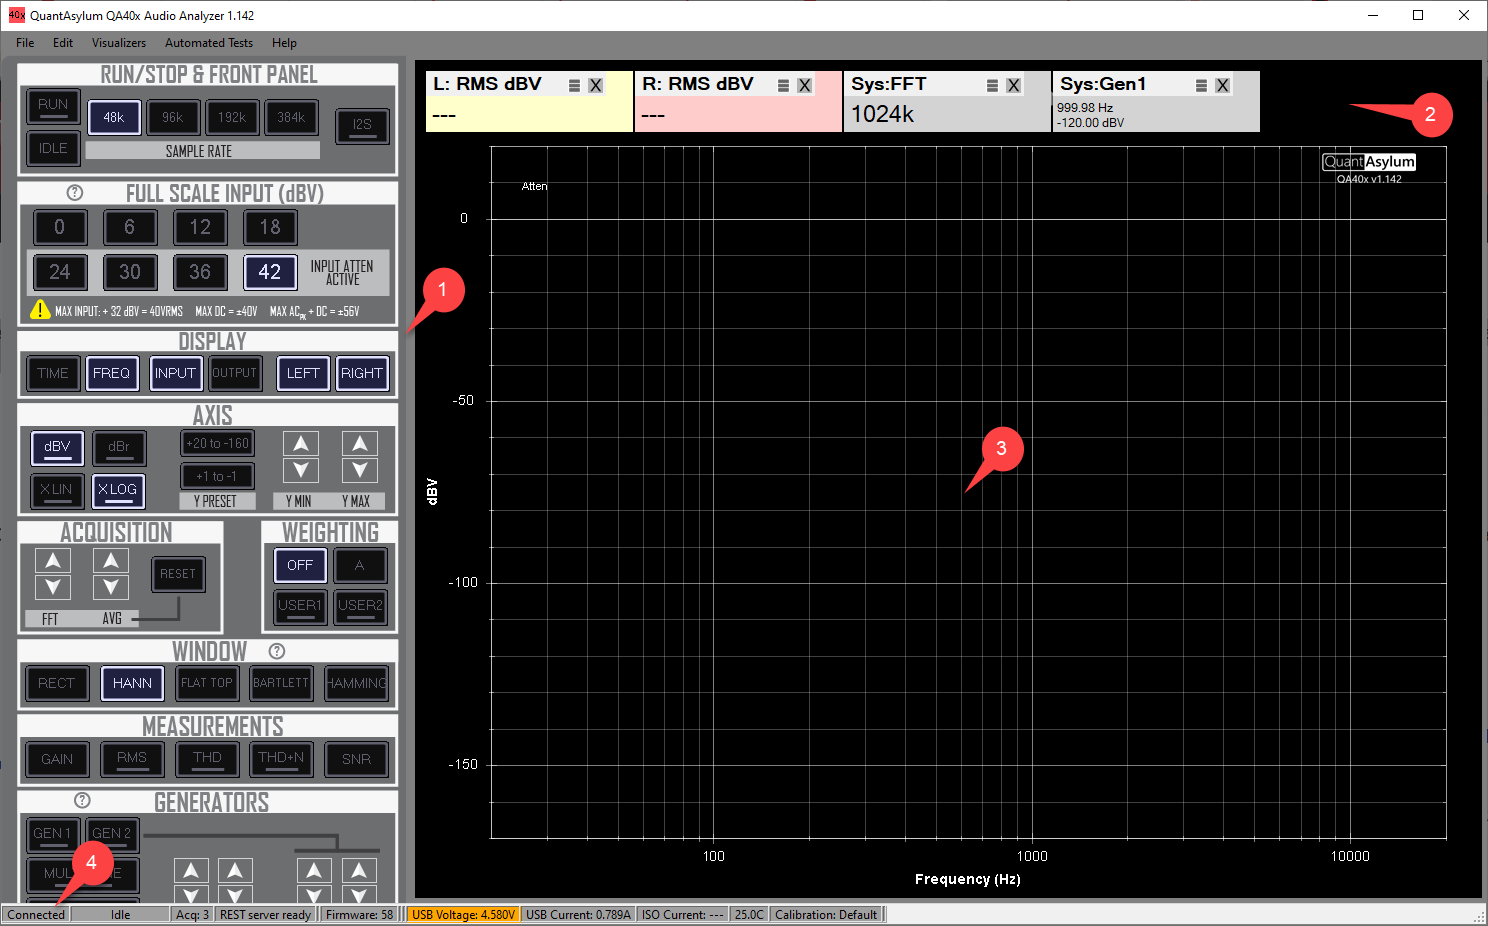
Before we get into making measurements, let's look the 4 regions of the application shown via callouts in the picture above.
Region 1 is the left side of the application. This is the control area. You can scroll the control area (if needed) my moving your mouse into the control area, clicking to give the control focus, and then using your mouse wheel to scroll up or down. If you are using a laptop with a trackpad, then a two-finger drag will usually emulate the mouse wheel. In release 1.202 and later, you can also use a finger to drag the control panel on a touch screen. This is accomplished by placing your finger in an area with buttons, and sliding up or down.
Region 2 is the measurement area. You can bring up a dialog to pick which measurements you want by clicking in this area. You can also close measurements by clicking the 'X' on each tile, and you can re-order the measurements by clicking your mouse in the "triple stack" next to the 'X' and dragging.
Region 3 is the graph display area.
Region 4 is the status bar.
For a first measurement, using a BNC cable and a shorting block, configure your QA40x as shown below (the red line represents a BNC jumper, and the red block represents a shorting block):
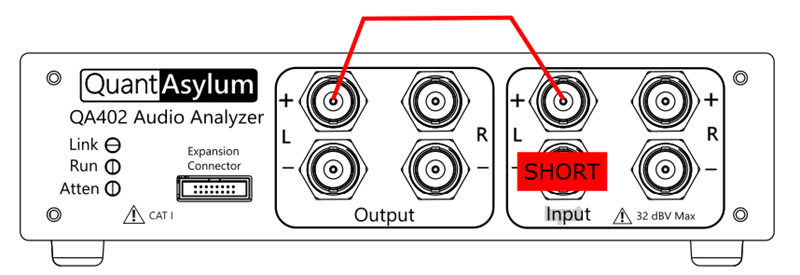
The configuration shown above is known as a single-ended loopback. And because we aren't using the L- input, it must be shorted to ensure it doesn't pick up extraneous noise. Shorting can be with a 0, 50 or 75Ω shorting block.
With the hardware configured, click in the control area on the left side of the application, and use the mouse wheel (or two finger drag on the trackpad) and reveal lower portion of the control panel. Specifically, we want to see the "Generators", "Full Scale Inputs" and "Run/Stop" portions of the panel as highlighted below:
In the Run/Stop section, you have the option to select a sample rate and RUN to begin an acquisition. The Idle button determines the behavior of the analyzer when it's NOT acquiring data. If the Idle button is off, the the analyzer will be "silent" when not acquiring. That is, nothing will come out of the outputs. If the Idle button is on, then the analyzer will emit a tone at the Gen1 settings (level and frequency) IF Gen1 is enabled.
The I2S button controls whether or not the front-panel Expansion Connector is generating a tone as specified by Gen1. Currently, the front-panel I2S feature is under development.
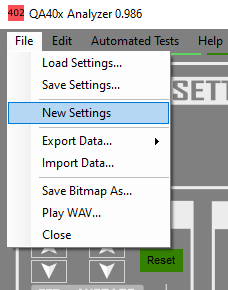
To get to a known starting point, select the File->New Settings menu option. Then, press the RUN button--aka the Run/Stop button--(item 1 in the screen below) and verify the Gen1 button (item 2) is enabled. You should see a yellow trace updating in the graph region (item 3).
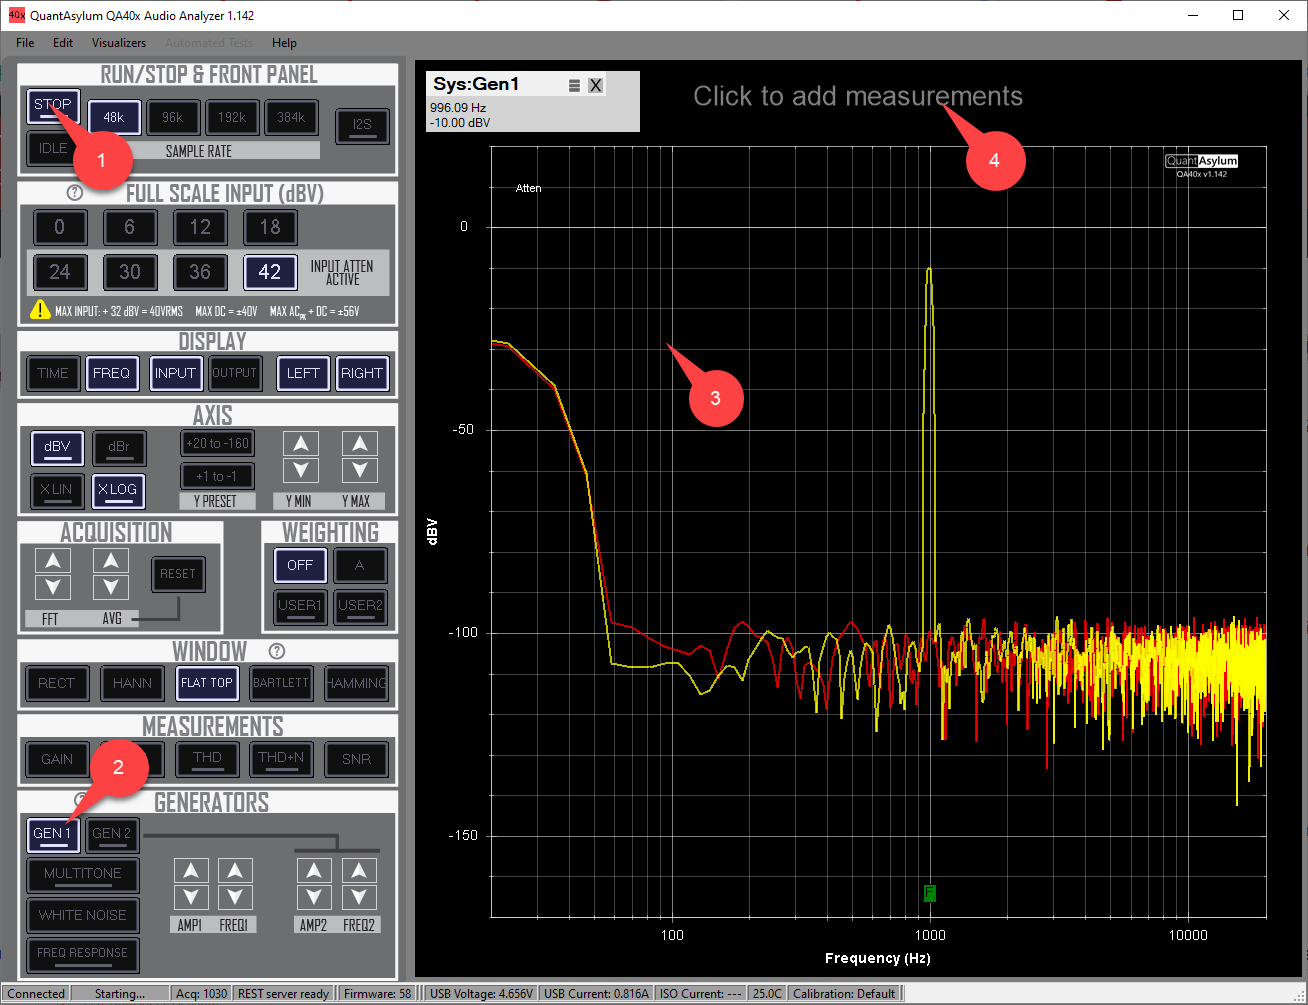
In the area highlighted by item 4 in the plot above, click in that region and you'll be greeted with a dialog that will allow you to add measurements. Add the following measurements (and THD and THD+N) and then click OK
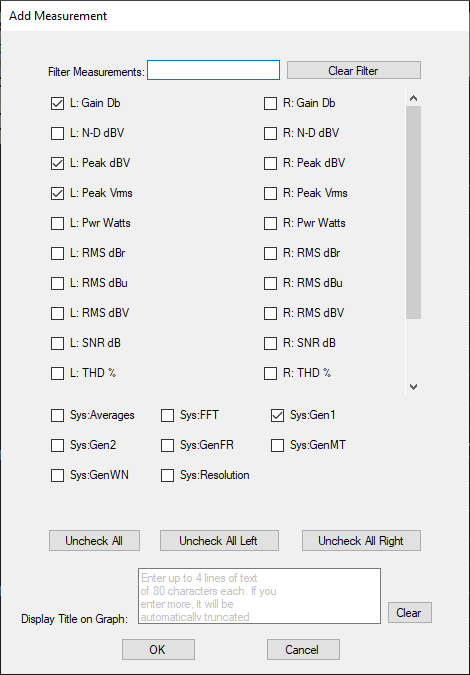
The application screen should now appears as follows:
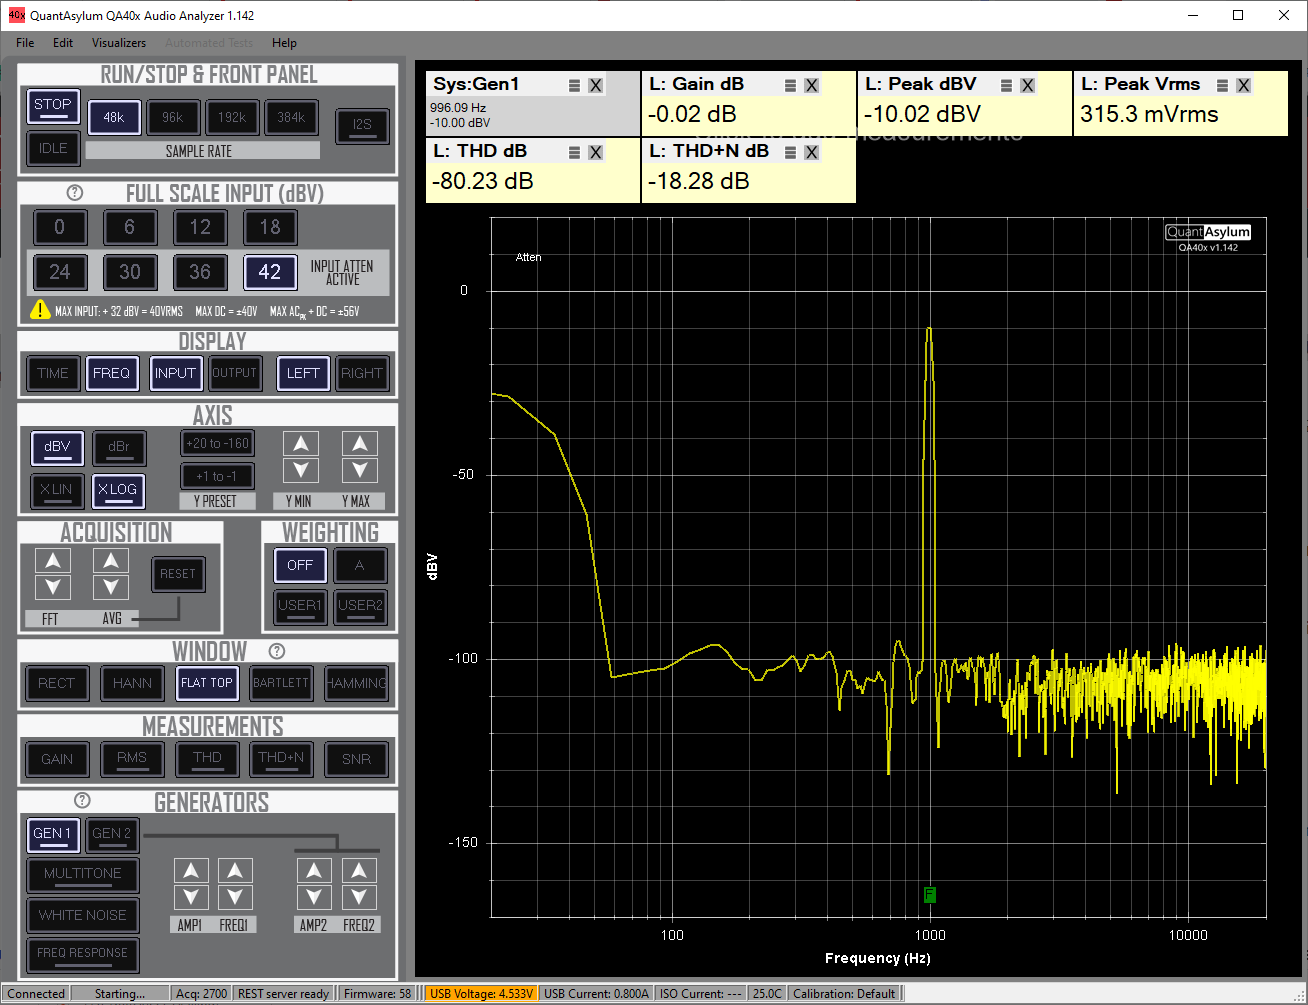
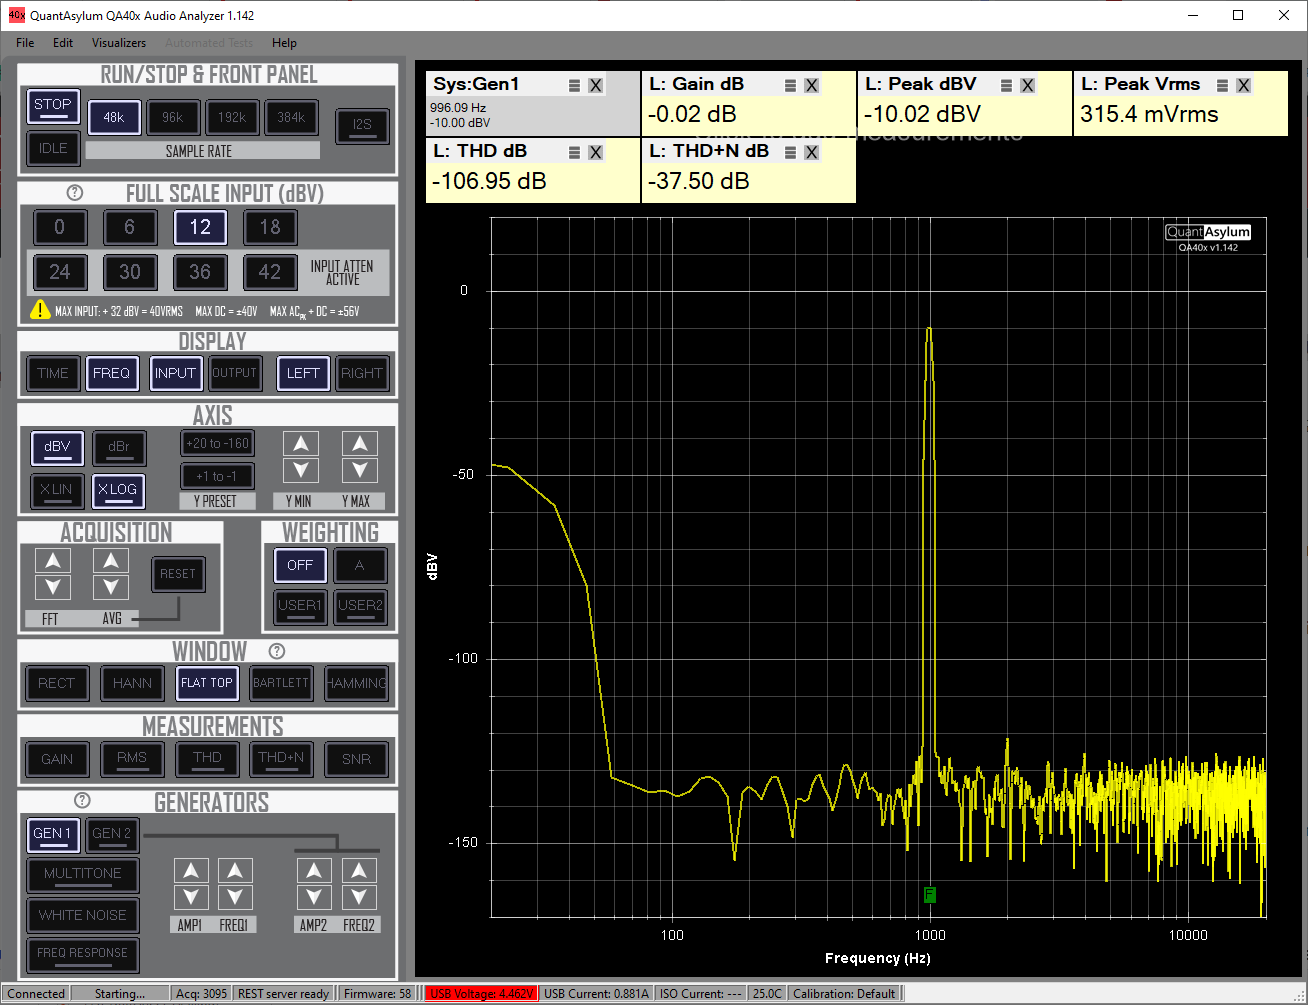
Now, notice our full scale input level is +42 dBV. Generally, we want to be about 5 to 20 dB below our full scale input for best performance. Since we're at -10 dB, +20 dB that would be +10 dBV. Let's pick +12 dBV as that is closest. Click the 12 button, and that should result in an audible relay click (due to the attenuator relay changing state) and an improvement to the measurement noise floor. Also, turn off the right channel (if showing) by clicking the RIGHT button in the "DISPLAY" control group:
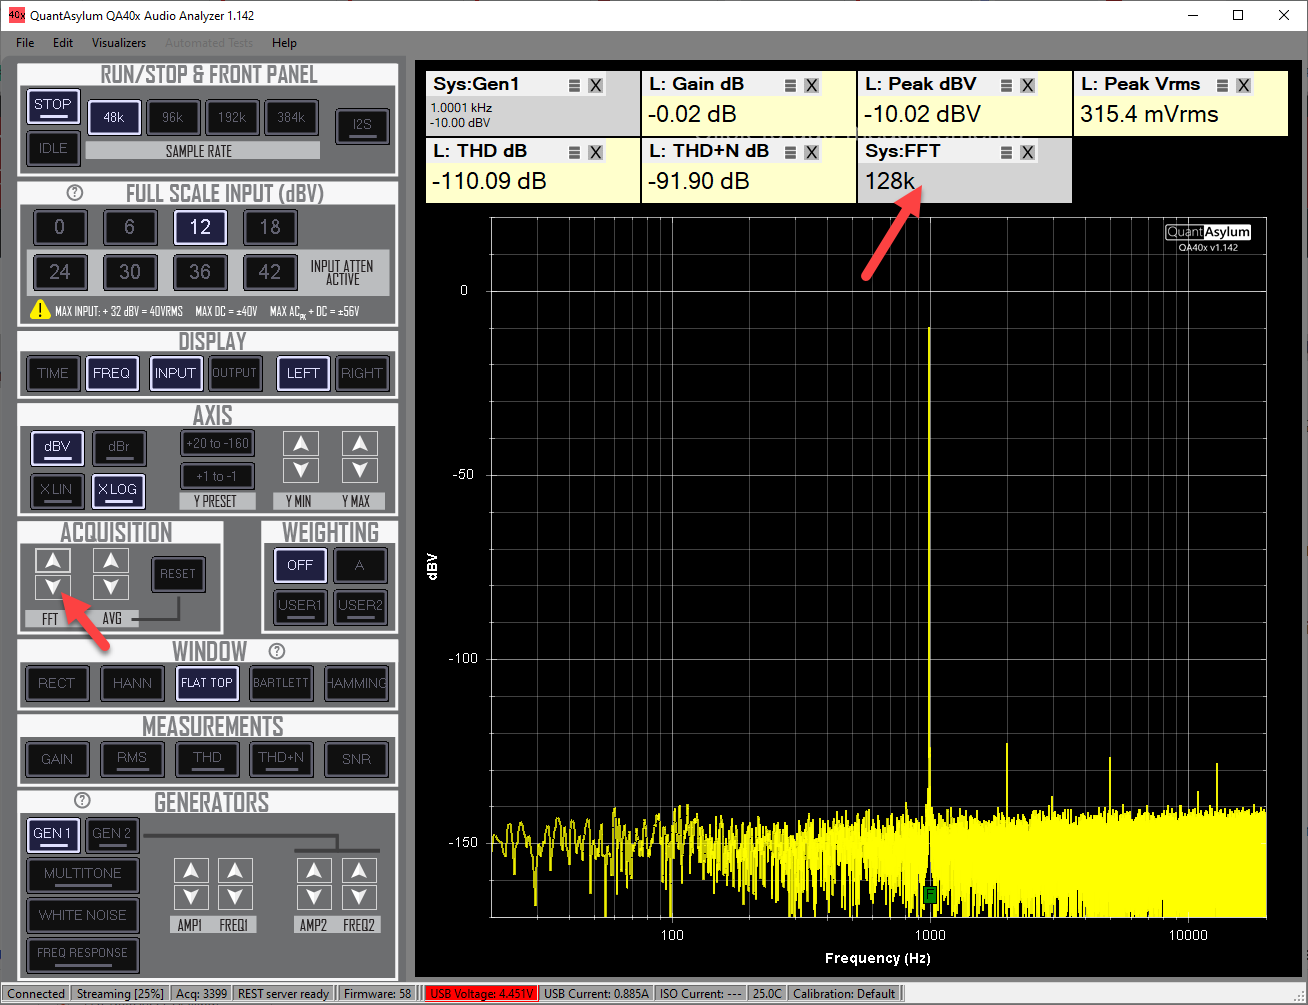
Next, let's increase the size of the FFT. When we change the FFT size, note the FFT measurement tile is automatically added to the display. You can also click on peaks and add markers. Larger FFTs give you a more detailed measurement, but they take longer to complete. Generally, when you are rapidly adjusting settings, you want to be on a smaller FFT (32K), and then once you have the settings you like, increase the FFT to 64K or 128K. For some measurements (such as THD), this might improve the measurement. For others (THD+N) it generally won't. You can experiment to understand the tradeoffs.
Frequency Response is a common measurement to make with an audio analyzer. A useful shortcut to get the analyzer back to a known state is the File -> New Settings menu option. This will set the analyzer to a known state, which is often easier than trying to put all the settings back to their default state by hand.
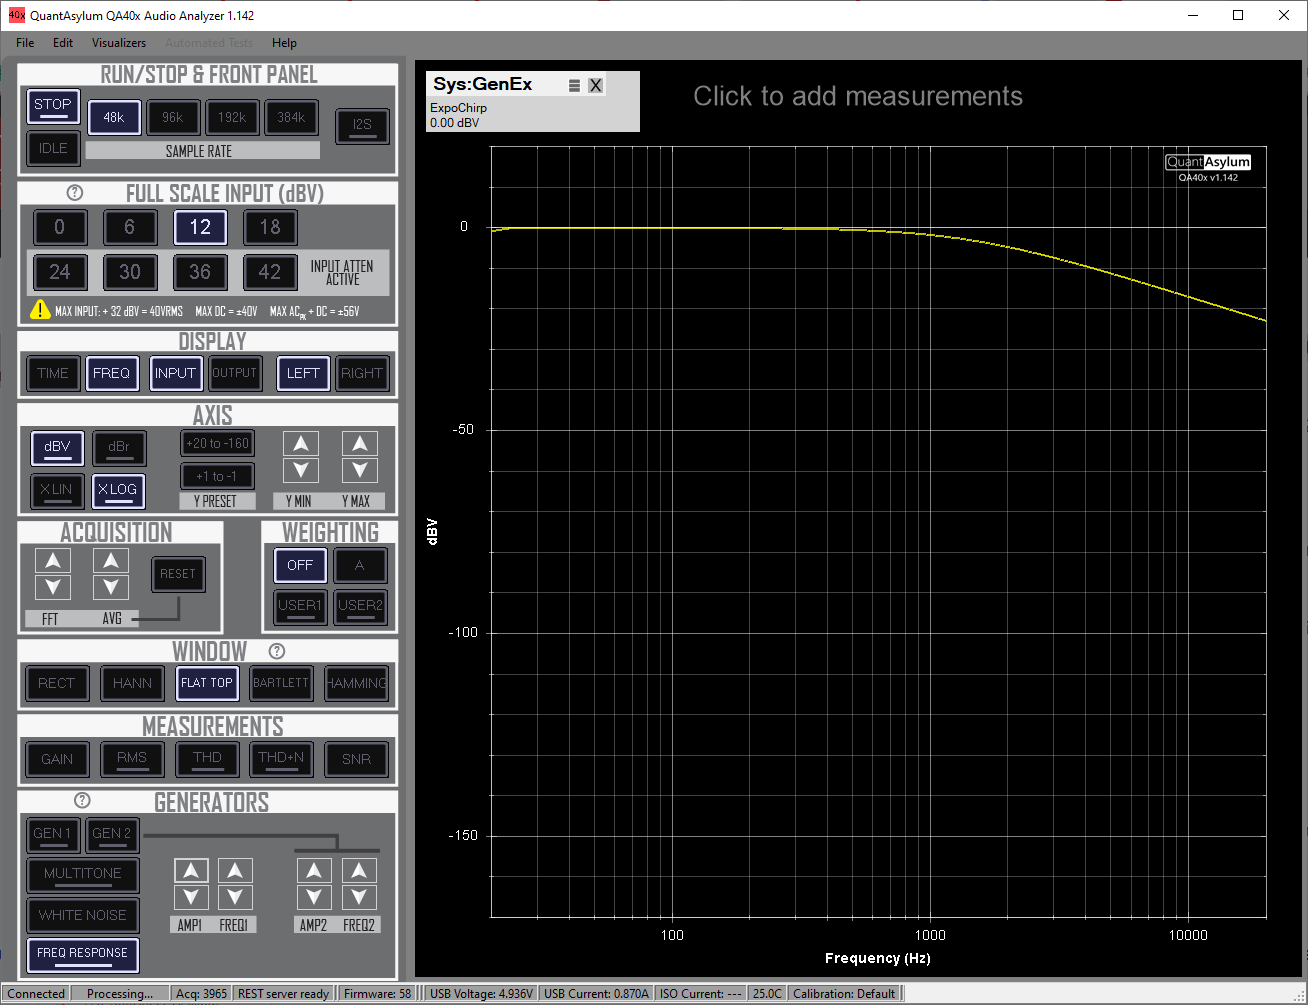
Once you have reverted to known settings, click on the Freq Response button and press the space bar. The Freq Response button will enable the frequency response mode of operation, and the space bar will begin acquisitions. If you can't see the Freq Response button, then either enlarge the window so you can, use the mouse scroll wheel to scroll in the control area to expose it, use the page up/down buttons or, if in a laptop, drag the trackpad with two fingers.

The device-under-test will be connected between the QA402 output and QA402 input. For the example below, a simple single-pole low-pass-filter was connected. Note that when the Freq Response button was pressed, we saw a measurement tile pop-up showing that we were using an expo chirp and it was at -12 dBV. Open the Expo Chirp context menu (right click on the Freq Response button, or control+click or click + hold) and adjust the amplitude to 0 dBV:
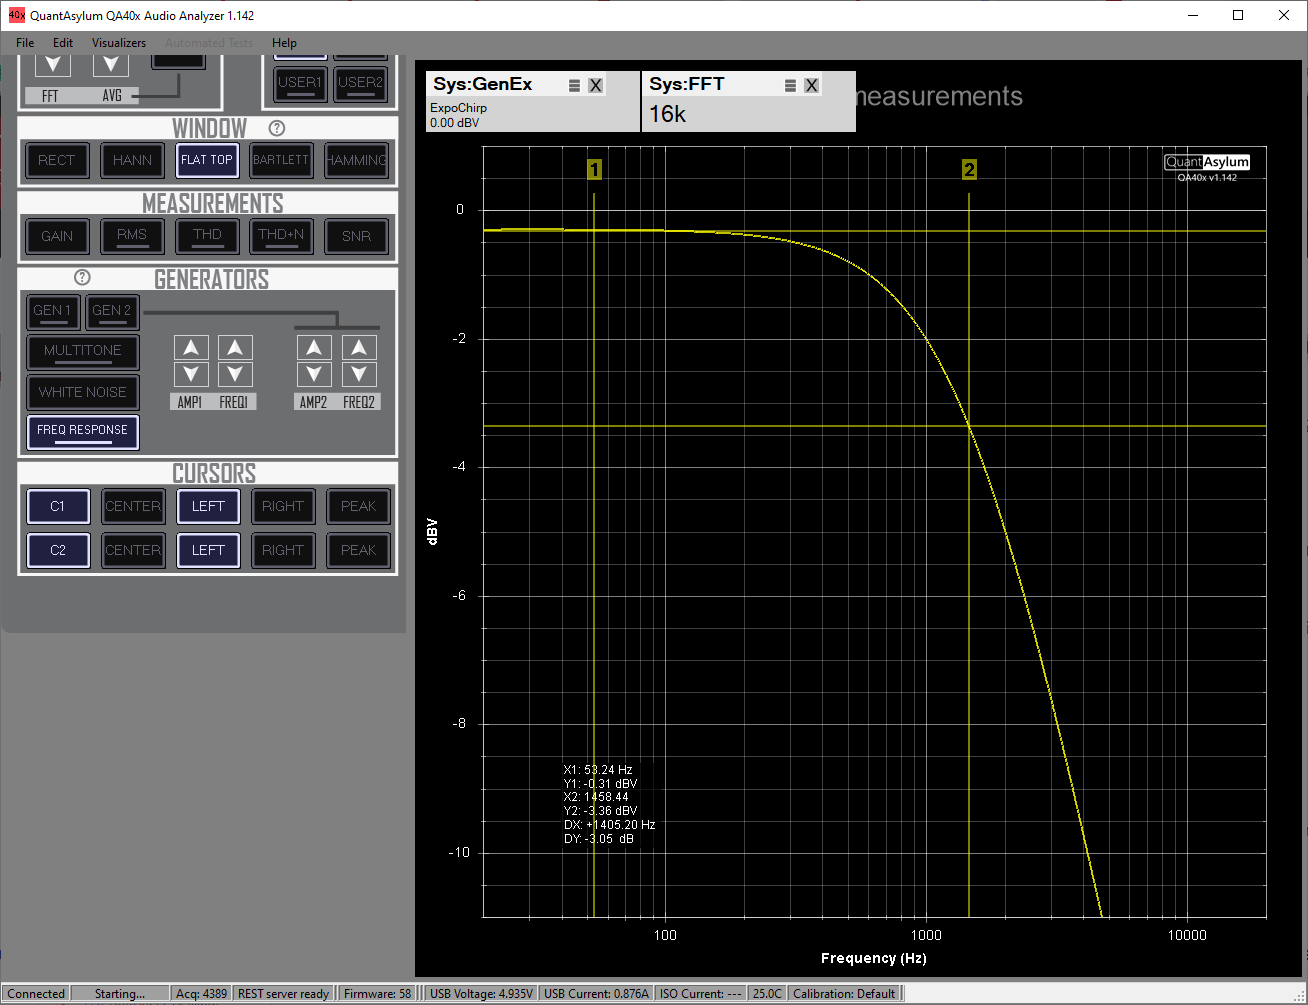
Finally, use the Y MIN and YMAX buttons to adjust the Y axis scale. You can also right click on the X LOG button in the Axis Settings control group to adjust the X axis from 100 to 10 kHz. Alternately, you can press the 1 to -1 button in the Axis Settings control group to quick change the Y Axis, followed by some adjustments using the Y MIN and Y MAX controls.
We can then click on the C1 and C2 buttons to enable the cursors. Drag C1 well into the the passband and move C2 until the DY is shown to be -3 dB. This is the 3 dB point of the low-pass filter, and we can see that it is 1458 Hz.
Noise is a basic audio measurement. Let's first measure the self-noise of the QA40x. Start with the following procedure
- Short all inputs of the QA402 using a BNC shorting block.
- Select File-> New Settings to get to a known state
- Change the FFT size to 128k.
- Add the measurement "RMS dBV"
- Set the full scale input to 0 dBV
The display should appear as follows:
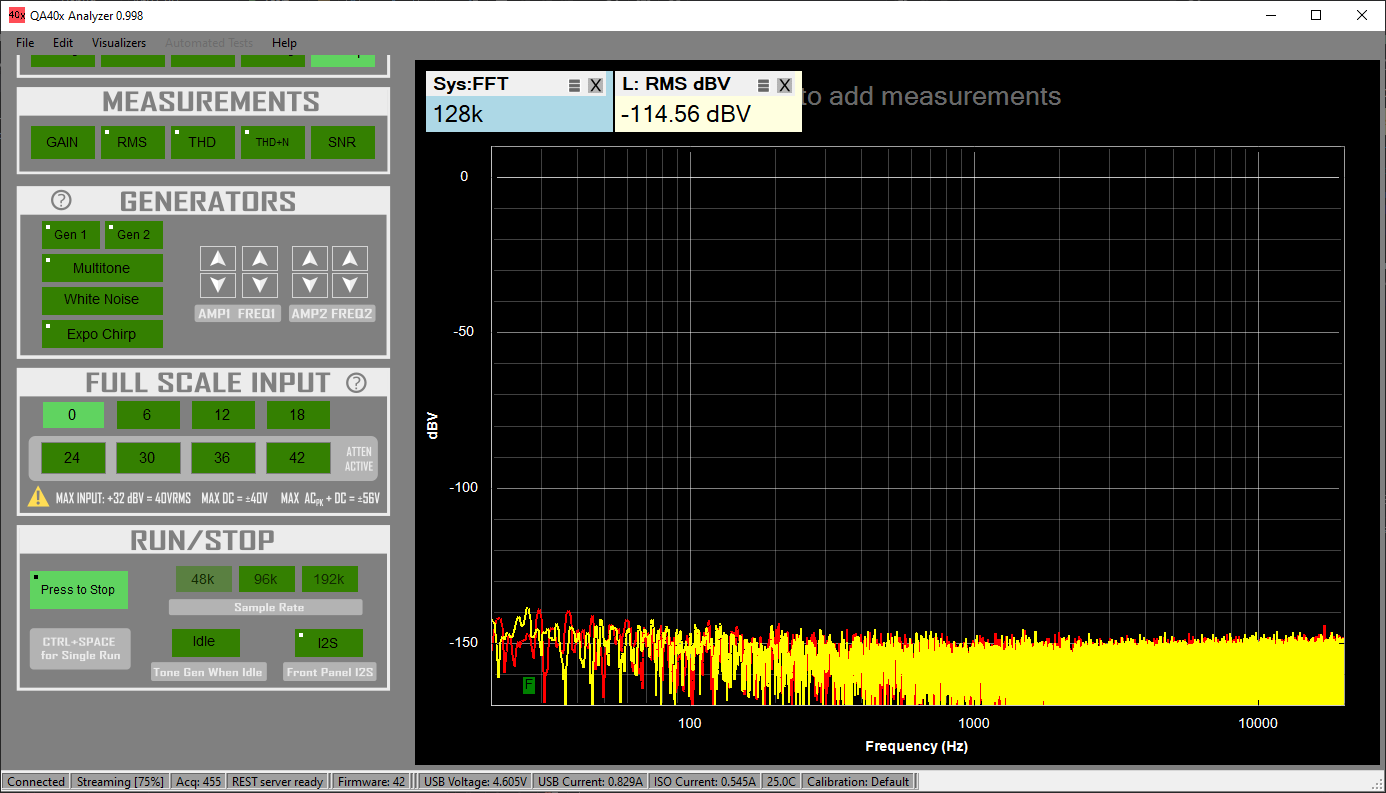
The self-noise of the QA402 would be reported as "-114.56 dBV (no weighting)."
If we wanted to make an A-weighted noise measurement, we'd press the A-Weighting button:
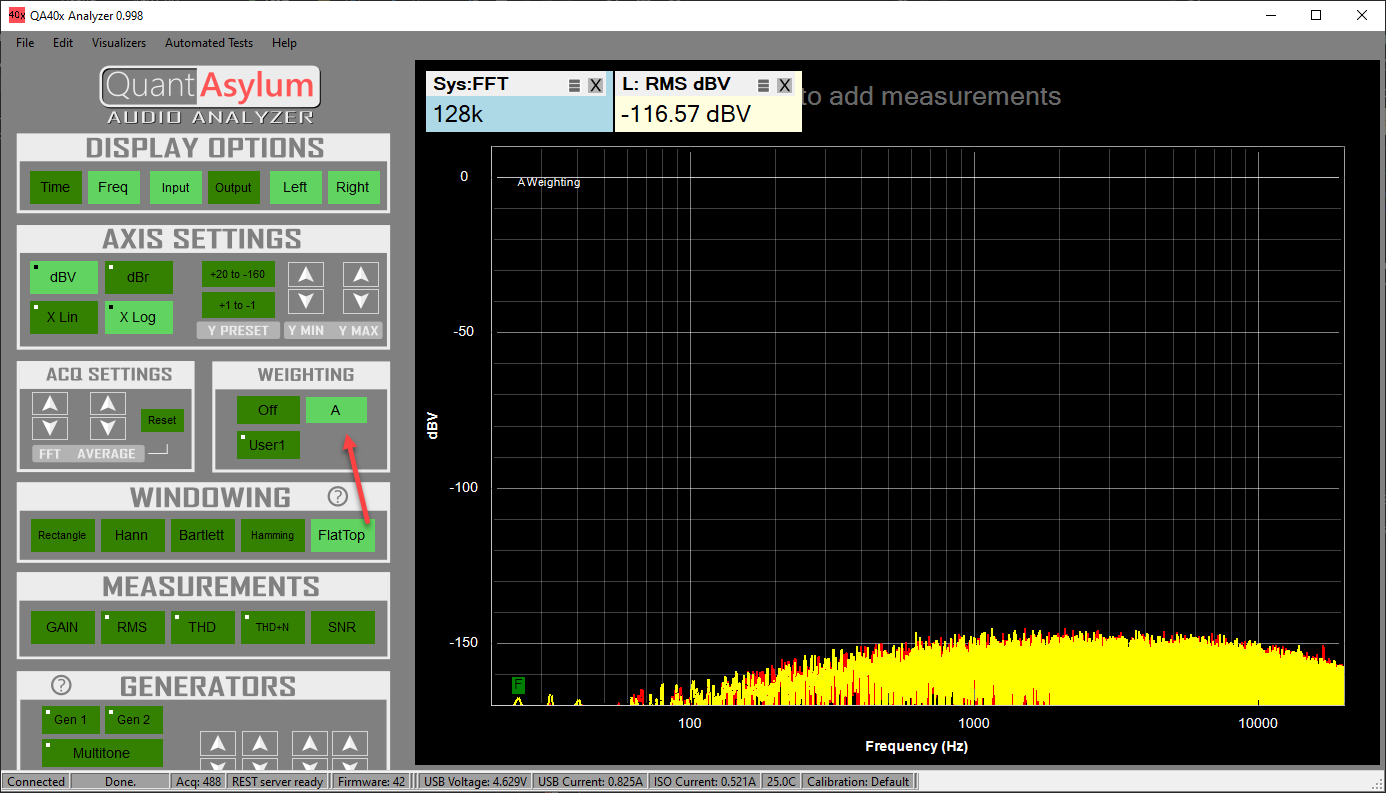
In this case, the self-noise of the QA402 would be reported as "-116.57 dBV (A Weighting)."
Note that as we change in the full scale input, the noise floor changes. That is, the noise floor will rise about 6 dB if we select the 6 dBV full scale input range.
While the above measures the self-noise of the QA402, you could replace the shorting blocks with BNC cables and connect to your DUT and make a noise measurement of that DUT.
To measure the THD or THD+N of the QA402 in loopback, do the following:
- Short the L- and R- inputs with a shorting block.
- Connect the L+ output to the L+ input, and the R+ output to the R+ input
- Select File-> New Settings to get to a known state
- Change the FFT size to 16k
- Enable Gen1 (the default amplitude is -10 dBV)
- Select +18 dBV full scale input
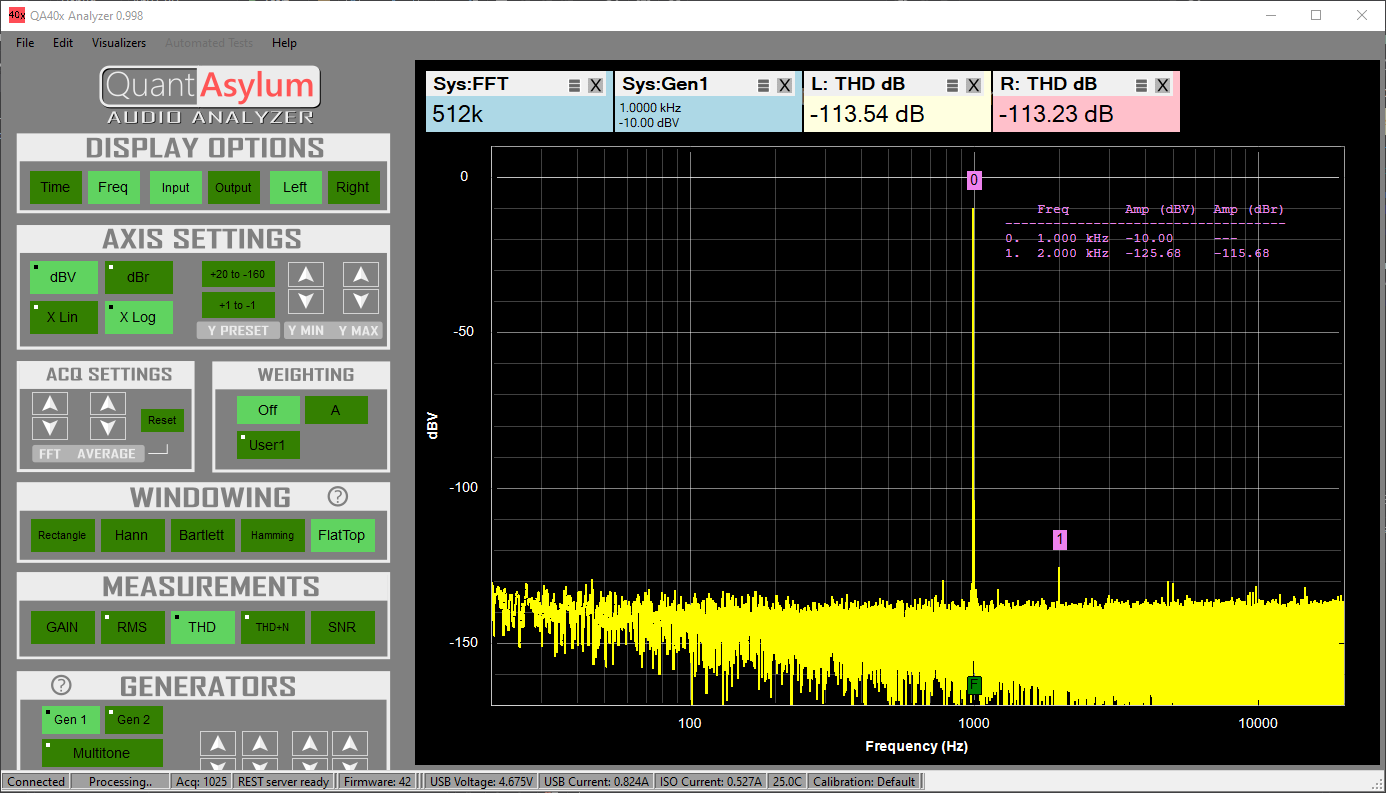
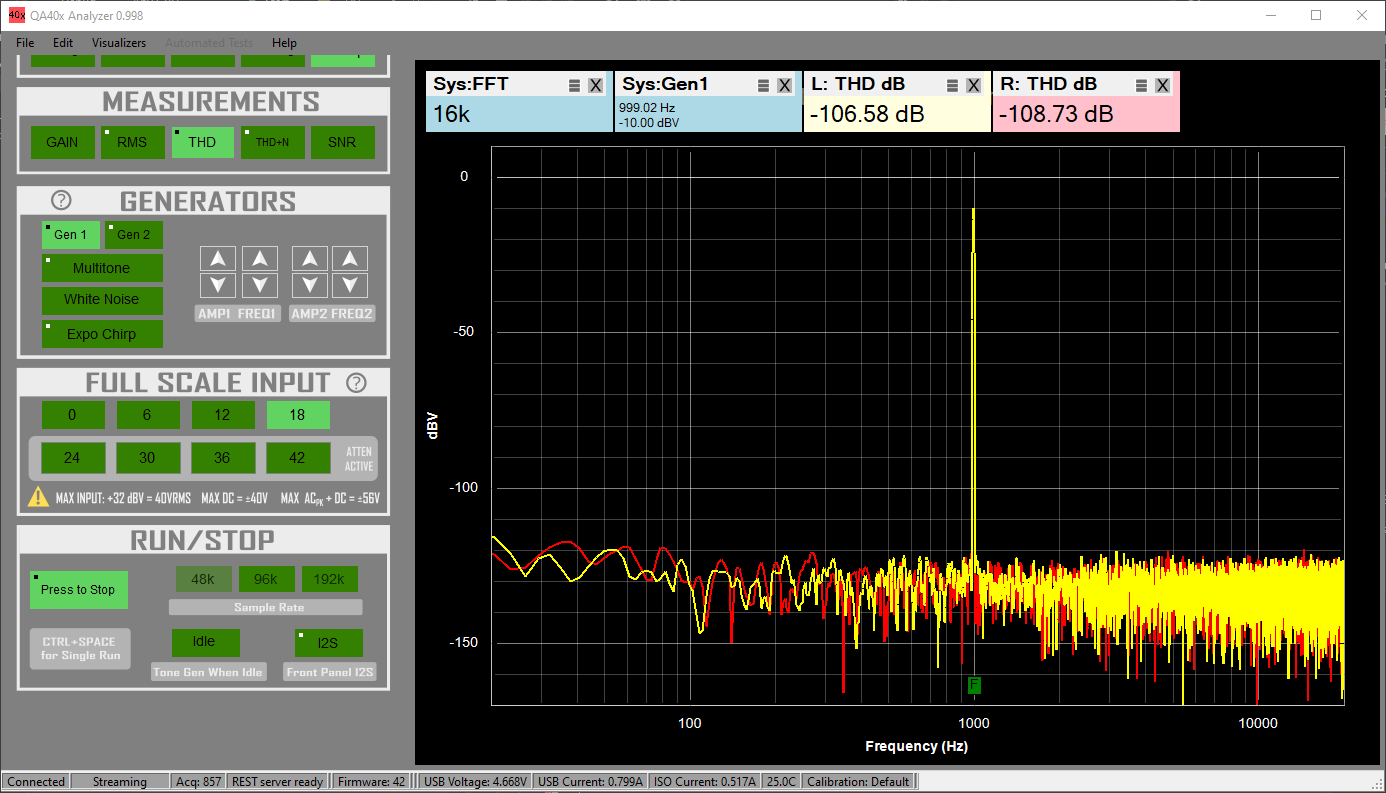
Begin running (press the run/stop button), and then press the THD measurement button (or, add the THD measurement by clicking at the top of the graph). You should see a display similar to what is shown below:
From the plot, we cannot see any harmonics. As you increase the FFT size, you'll reduce the displayed noise floor and harmonics should appear. Increase the FFT size to 512k, and disable the right channel. Then, click on the peak of the fundamental and a harmonic to display markers. Note the markers will only update after an acquisition is complete, so monitor the status in the lower left to watch a cycle complete. The graph should be similar to that below: