Verifying Calibration
The QA402 and QA403 hardware (referred to as the QA40x hardware) are factory calibrated against a Rigol DM3068 6.5 digit digital multimeter. The DM3068 offers True RMS AC voltage readings up to 300 kHz, with a specified accuracy of ±0.06% + 0.03% of the range when within 1 year of calibration. This means on the 2Vrms range, the expected accuracy for calibrating a 1Vrms signal would be ±(600uV + 300uV), or about ±1mV. Once the 1V calibration is established inside the QA40x, that calibration is then used to calibrated the other ranges on the QA40x hardware. This works because the linearity of the converters used in the QA402 and QA403 are exceptional--far better than even a 6.5 digit DVM. At each step, the calibration is compared to a specified window to ensure the uncalibrated performance of the QA40x hardware is within expectation. Without this, a missing part during SMT assembly could effectively be calibrated out. So, in summary, 6.5 digit multimeter that was calibrated in a factory using standards traceable to NIST is used to calibrate the 1Vrms range on the QA40x hardware, and that calibration is then used to calibrate the other ranges on the QA40x.
The process for verifying the calibration is explained below. If you encounter unexpected readings or wonder if your hardware might have been damaged, this is a quick and easy process you can do to check.
Before starting, you will need a good DVM that has had a recent calibration. Most DVMs are very accurate for AC measurements at 50 or 60 Hz, but at 1 kHz, some DVMs suffer from roll-off, and the readings at 1 kHz might be a bit low. A good DVM that reads accurately at 1 kHz is a Fluke 115 multimeter. In the lab, the AC measurement at 1 kHz is unchanged from the 60 Hz reading.
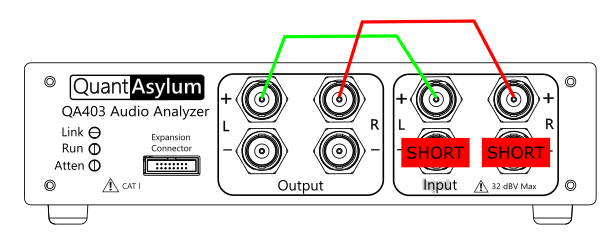
Connect the QA40x into single-ended loopback as shown:
In the QA40x application, do a File->New to set the analyzer to a known state. Press the Frequency Response button, adjust the FFT size to 32K, and then press RUN. You should see a frequency response trace. With some tweaking of the settings (set to 0 dBV max input, zoom settings, adding cursors) we can get a plot as follows. In this plot, notice the amplitude difference between 1 kHz and 60 Hz is 0.00 dB:
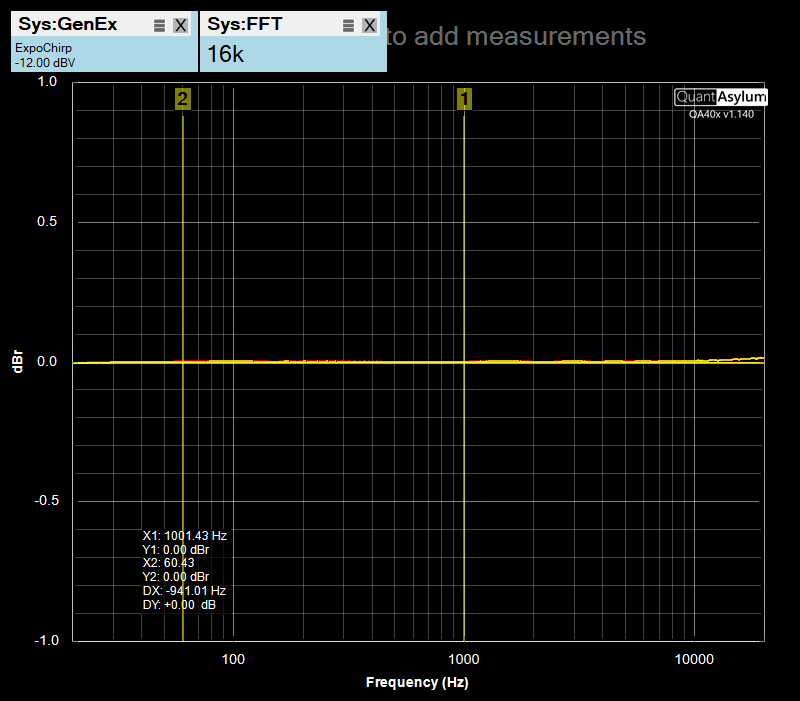
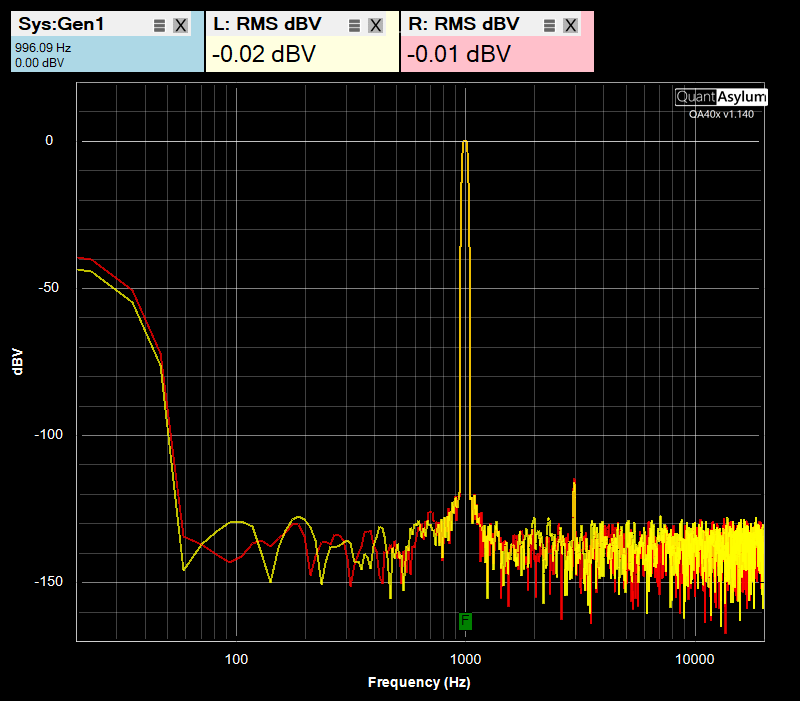
Above, the flat response shows that the output difference in the QA40x DAC output and ADC input is the same whether you are at 60 Hz or 1 kHz. Next, use your DVM to measure a sine generated by the QA40x. To generate a sine wave, do File->New, Run, press the Gen1 button, right click on Gen1 to get the context menu, set to 0 dBV, press RMS button to get RMS measurement). A plot of this is shown below:
At this point, the output of the DAC is bursted, which is the normal measurement mode for the QA40x hardware. To switch to a continuous output, stop the measurement and press the IDLE button (the 'i' key on your keyboard also toggles IDLE tone generation). This will generate the tone you specified in the GEN1 settings continuously, which can be measured by your DVM.
Using your DVM, measure the AC level at the 1 kHz and 60 Hz. Both should read very close to 1.000Vrms volts (ideally +/- 0.002V). The aim here is to understand how your DVM responds at 1 kHz versus 60 Hz.
With the QA40x generating a continuous tone of either 1 kHz or 60 Hz, verify all the QA40x outputs (L+ and L-, and R+ and R-) are the same level, and very close to 1.00Vrms (+/- 0.002V)
With the output levels confirmed as correct, we can move to verifying the input and output ranges on the QA40x. To do this, we'll perform a sweep. Connect the QA40x into single-ended loopback as shown above, do a File-New, increase the FFT size to 32K, and then from the Automated Tests menu, select the AMP Gain and Distortion versus Amplitude test. The setup will appear as shown:
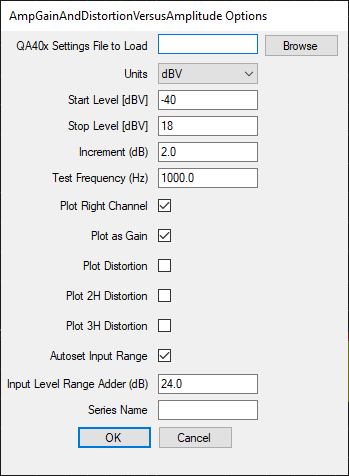
In the above settings, we are telling the QA40x to sweep from -40 to +18 dBV at 1 kHz, and to report the gain between output and input. We're also telling the QA40x to "autoset" the range. That is, when 0 dBV is measured on the input, use the 20 dBV input range (the actual range will be the nearest available range). This ensures that as we step through all the output levels, we'll exercise all the input relays. And the output relays will be automatically exercised as the output levels change. While the test runs, keep your eyes on the input level buttons. You'll see they are all used. The test graph should show something similar to the following:
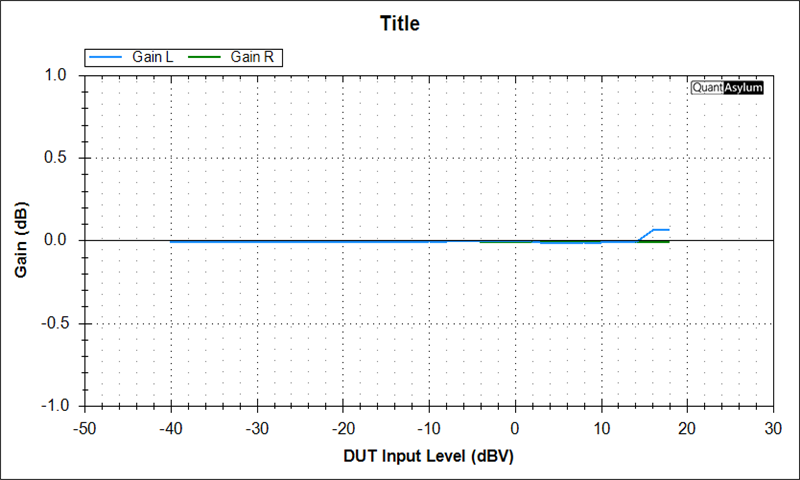
We can zoom in by changing Y1 Max and Min values to +/-0.1 dB:
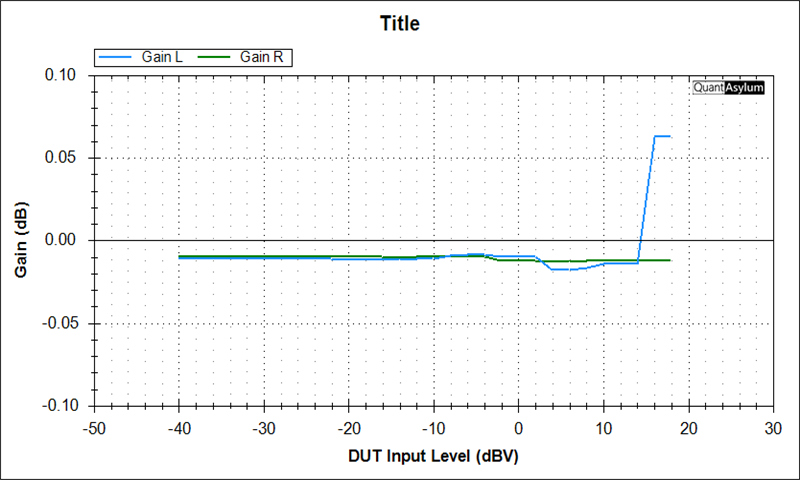
The test above has exercise all the input and output relays, and verifies that the gain (which is really the amplitude error for loopback) is within reasonable limits. The slight deviation you see at the 16 and 18 dBV output levels can be expected. Some might be related to internal compression that is done in software to ensure the output isn't clipping, while others might be related to drive limitations and could be exacerbated as load impedances drop.
It's not clear yet how the ADC and DACs in the QA403 will "age" over time because they are new. This can be estimated somewhat by artificially aging the silicon using higher temperatures. This is commonly known as a HTOL ("high temperature operating life") test, which accelerates the aging process of an IC. This is accomplished by applying power the device and letting it bake while running at an elevated temperature. Roughly, for every 10C you increase the operating temperature, you double the failure rate. The failures generally come from electro-migration, which presumably would also cause shifts in performance over time. TI has a good document (SPRABX4B) on the process HERE.
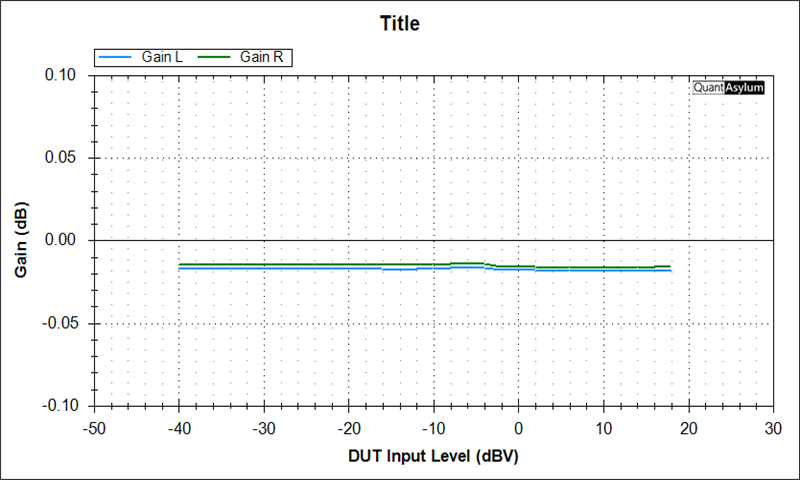
A QA403 that has undergone 50X acceleration factor for 24 hours (equivalent to 1200 hours of powered operation at room temperature) is shown below and it's relatively unchanged from its starting point. There is roughly a 0.01 dB shift in loopback gain.
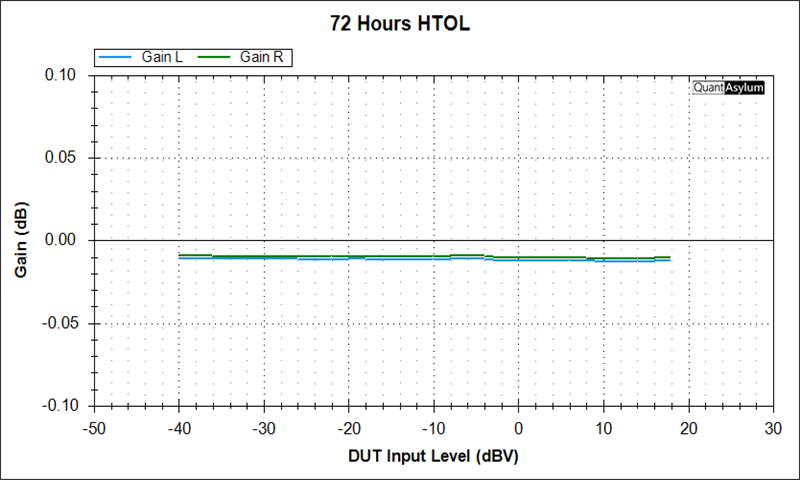
After 72 hours of 50X acceleration (equivalent to 3600 hours of operating life which is 150 days of continuous operation, or about 2 years when operating for five hours per day) we have the plot below. This has shown a slight shift back to the center.
The tests above make it easy to determine if your QA40x hardware is performing as expected in terms of gain accuracy. And the tests above can be repeated at different operating temperatures if your needs are critical. If your measurements are showing an excessive deviation, send us a mail or post a note on the forum. We can always re-calibrate, or we could add the ability for you to recalibrate in your lab if the need arises. Since the converters are new, we'll continue to monitor.